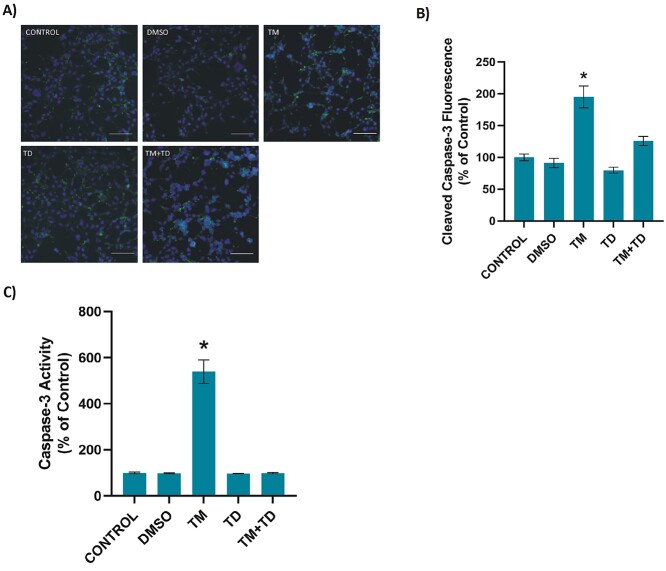
Fig. 3.
Caspase-3 in kidney cells. A) Representative immunofluorescent staining of cleaved caspase-3 in HEK-293 cells incubated with either 1 μl/ml DMSO or 5 μg/ml TM for 24 h. .156 mM TUDCA (TD) was applied for 12 h. In the TM + TD group, TUDCA (.156 mM) was given 12 h after 5 μg/ml TM application, with a total TM incubation time of 24 h. Bar, 200 μm. B) Quantitation of cleaved caspase-3 fluorescence staining was estimated by ImageJ software. Data shown are representative of 15 separate experiments and values are shown as mean ± SEM. Statistical analysis was performed by one-way ANOVA with all pairwise multiple comparison procedures done by Tukey’s multiple comparison test. *P < 0.001, vs. all other groups. C) Caspase-3 activity. Data shown are representative of 6 separate experiments and values are shown as mean ± SEM. Statistical analysis was performed by one-way ANOVA with all pairwise multiple comparison procedures done by Tukey’s multiple comparison test. *P < 0.001, vs. all other groups.

