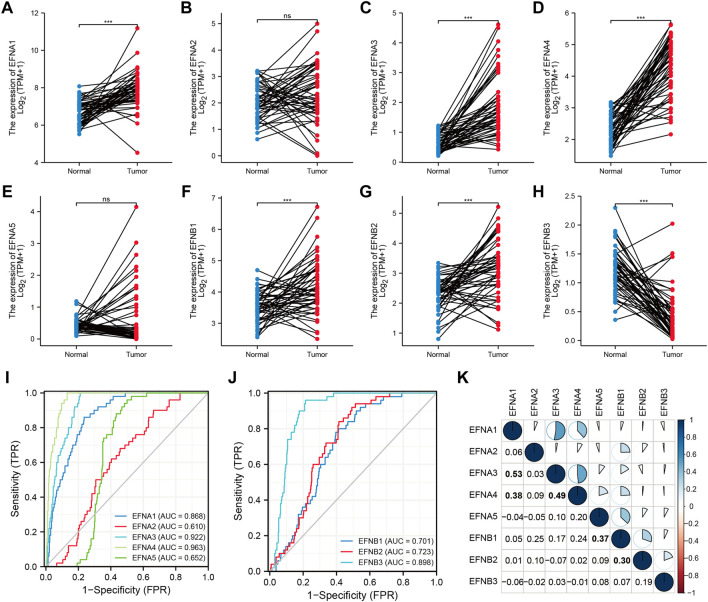
FIGURE 1.
The expression levels and diagnostic significance of ephrin members in HCC tissues based on TCGA database. (A–H) The differential expression of EFNs (EFNA1, EFNA2, EFNA3, EFNA4, EFNA5, EFNB1, EFNB2, EFNB3) in tumor tissues compared with paired normal tissues in HCC. ns: no significance; ***p < 0.001; (I,J) The diagnostic role of EFNs identified by receiver operating characteristic (ROC) curves. (K) Correlation analysis of each EFN member based on Pearson’s correlation analysis. The bold values represent significant correlations between the EFN members.

