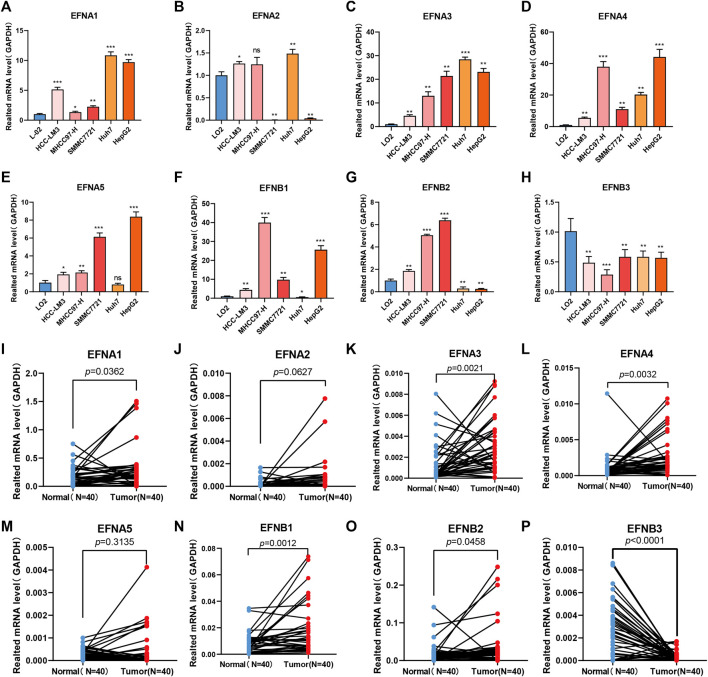
FIGURE 11.
Ephrin family genes are abnormally expressed in HCC cell lines and HCC tissues. (A–H) RT–qPCR analysis of the mRNA expression of ephrin genes in five HCC cell lines (HCC-LM3, MHCC97-H, SMMC 7721, Huh-7, and HepG2) and a normal liver cell line (LO2). EFNA1 (A), EFNA2 (B), EFNA3 (C), EFNA4 (D), EFNA5 (E), EFNB1 (F), EFNB2 (G), and EFNB3 (H). (I–P) The mRNA expression of ephrin genes in 40 pairs of HCC tissues and adjacent para-carcinoma tissues was evaluated using qPCR. EFNA1 (I), EFNA1 (I), EFNA2 (J), EFNA3 (K), EFNA4 (L), EFNA5 (M), EFNB1 (N), EFNB2 (O), and EFNB3 (P). GAPDH was used as an internal control. Error bars represent the means ± SEM (triplicate experiments). *p < 0.05; **p < 0.01; ***p < 0.001.

