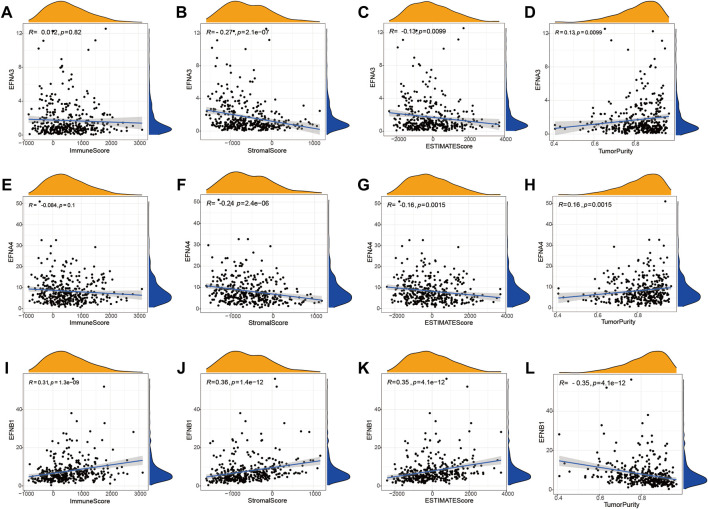
FIGURE 6.
Correlation between the expression of prognostic ephrin genes and the tumor microenvironment based on the ESTIMATE algorithm. (A–D) The correlation between EFNA3 expression and immune/stromal/ESTIMATE/tumor purity scores. (E–H) The correlation between EFNA4 expression and immune/stromal/ESTIMATE/tumor purity scores. (I–L) The correlation between EFNB1 expression and immune/stromal/ESTIMATE/tumor purity scores. R: Spearman’s rank coefficient.

