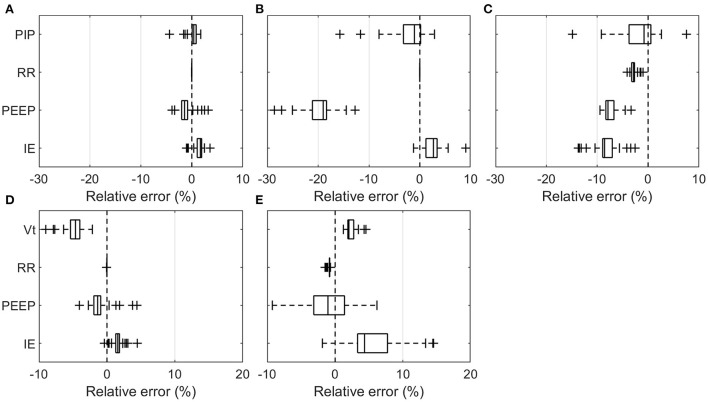
Figure 3.
Boxplot representation of the relative error over all means of the individual measurement sets listed in Table 3. PIP, Vt, RR, PEEP, and I:E are shown at varying RR, PEEP, I:E, Crs, and Raw for the pressure- and volume-controlled ventilators. (A) Hamilton T1 (PCV+), (B) HEV, (C) GirVent, (D) Hamilton T1 ((S)CMV+), and (E) breathe. Each point represents the mean value of one experiment.

