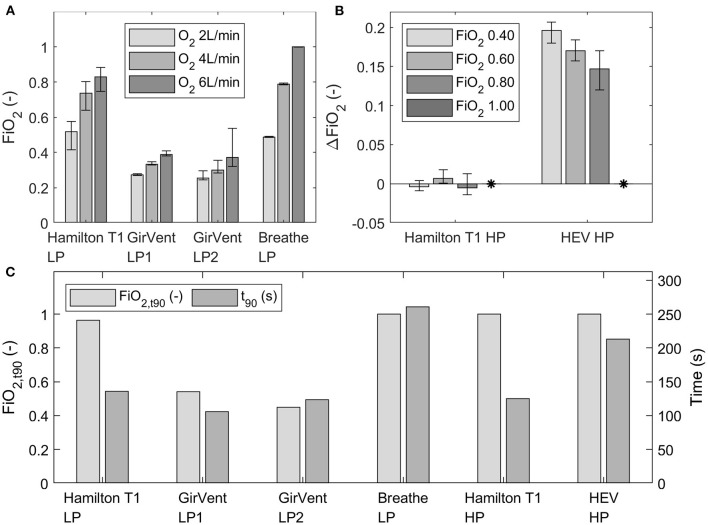
Figure 6.
(A) Mean FiO2 at three O2 flow rates (2 L min−1, 4 L min−1, and 6 L min−1) for the ventilators with low-pressure O2 supply, depicted over the last 30 s of steady state. (B) Measured ΔFiO2 in the Hamilton T1 and HEV (high-pressure port) to the set FiO2 concentrations in the UI (0.40, 0.60, 0.80 and 1.00). The measured ΔFiO2 with an FiO2 setting of 1.00 in the UI is indicated by *. The error bars indicate the fluctuation (minimum and maximum) observed at steady state. (C) Achieved FiO2, and t90 values at an O2 flow rate of 12 L/min (low pressure) or at a set O2 concentration of 100% (high pressure) of each ventilator.

