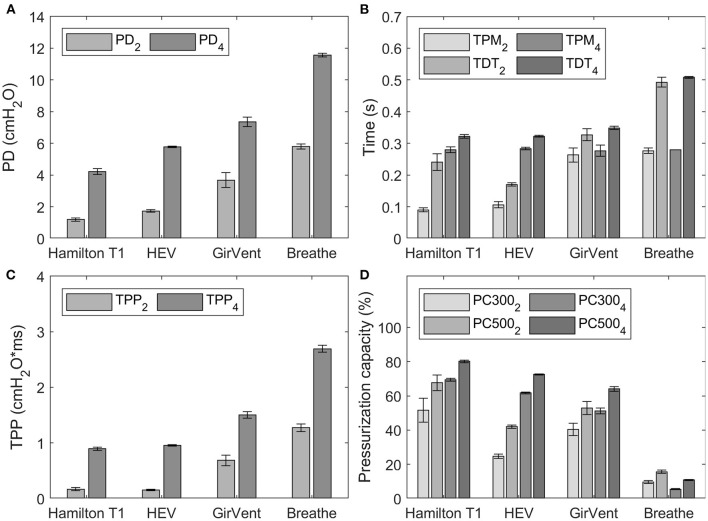
Figure 7.
Results of the trigger characteristics for occlusion pressure values (P0.1) of 2 cmH2O/100 ms and 4 cmH2O/100 ms, indicated by the subscript in the corresponding legend. Error bars indicate the standard deviation. (A) pressure drop (PD), (B) time to pressure minimum (TPM) and trigger delay time (TDT), (C) time pressure product (TPP), and (D) pressurization capacity after 300 ms and 500 ms (PC300 and PC500).

