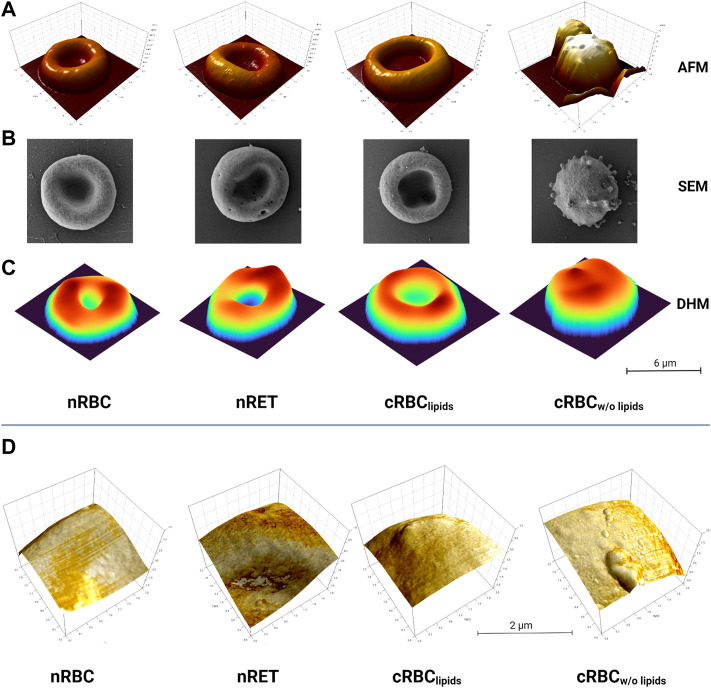
FIGURE 1.
Imaging. Images of nRBC, nRET, cRBClipids and cRBCw/o lipids using (A) AFM, (B) SEM and (C) DHM technology (scale bar is 6 µm). All imaging techniques reveal a nearly biconcave shape for cRBClipids, widespread membrane vesiculation and a high grade of sphericity only for cRBCw/o lipids compared to native red blood cells. (D) Detailed AFM images of cell surfaces of nRBC, nRET, cRBClipids and cRBCw/o lipids depicting enhanced vesiculation of the membrane of lipid-poor cells, while the others do not show these peculiarities (scales: 2 μm × 2 µm). All images are representative images of n > 50 per cell type and imaging method.

