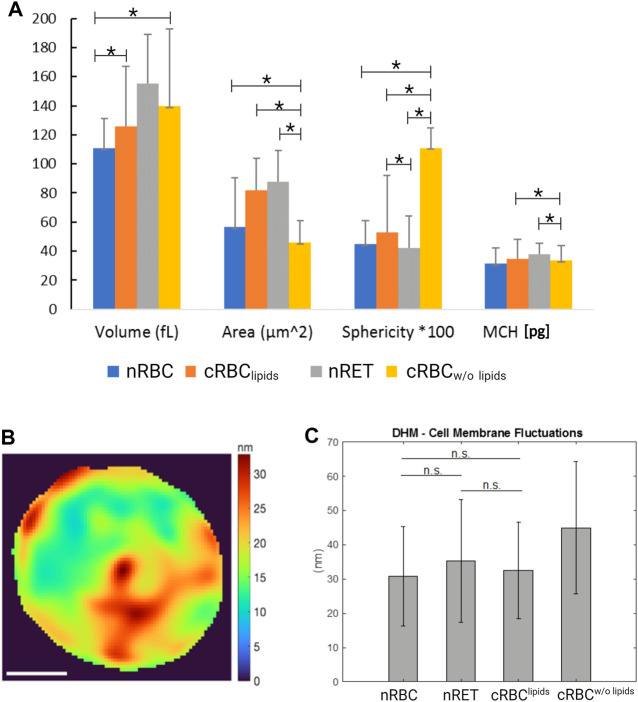
FIGURE 2.
DHM analyses. (A) Cell morphological parameters (volume, area, sphericity) and MCH measured by DHM for: nRBC (n = 49), nRET (n = 46), cRBClipids (n = 52), cRBCw/o lipids (n = 47). The units are given in femtoliter [fl] for volume, micron squared [μm2] for area and [g/dl] for MCH. The effective values for sphericity are multiplied by 100 for the representation in the graph. Mean ± standard deviation (*p < 0.05). (B) Cell membrane fluctuation (CMF) measured by DHM: example of CMF values over a cRBClipids cell (scale bar is 2 μm) (C) mean and std of CMF measured by DHM for nRBC, nRET, cRBClipids and cRBCw/o lipids.

