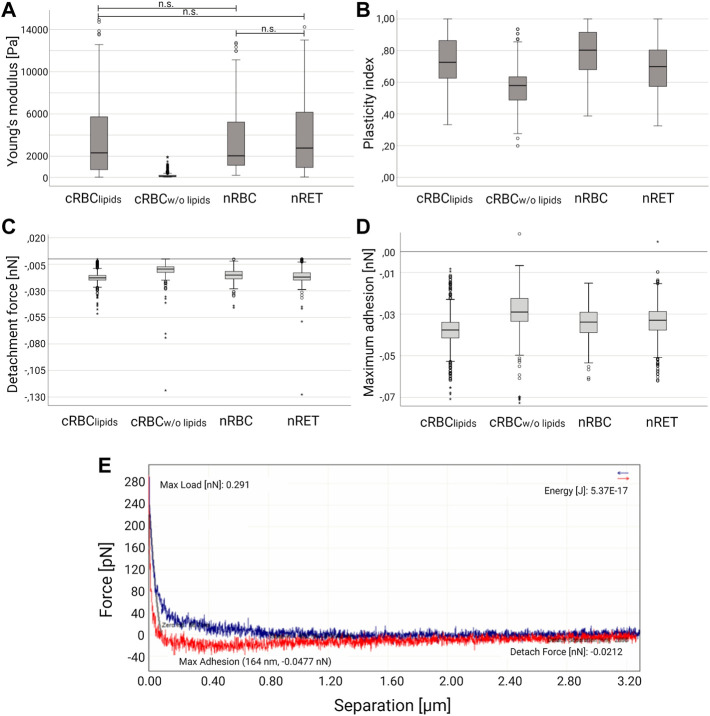
FIGURE 3.
Atomic force microscopy spectroscopy. Box-whisker plots show differences in (A) Young’s modulus, (B) median plasticity index (C) detachment force and (D) maximum adhesion for nRBC (n = 625), nRET (n = 1,697), cRBClipids (n = 842) and cRBCw/o lipids (n = 310). According to the statistical distribution of the data, a non-parametric test for independent samples was performed to compare the four groups (Kruskal–Wallis test with Bonferroni correction). The groups differ statistically significant (p < 0.05) unless otherwise stated (n.s.). (E) Representative force-separation curve (nRET).

