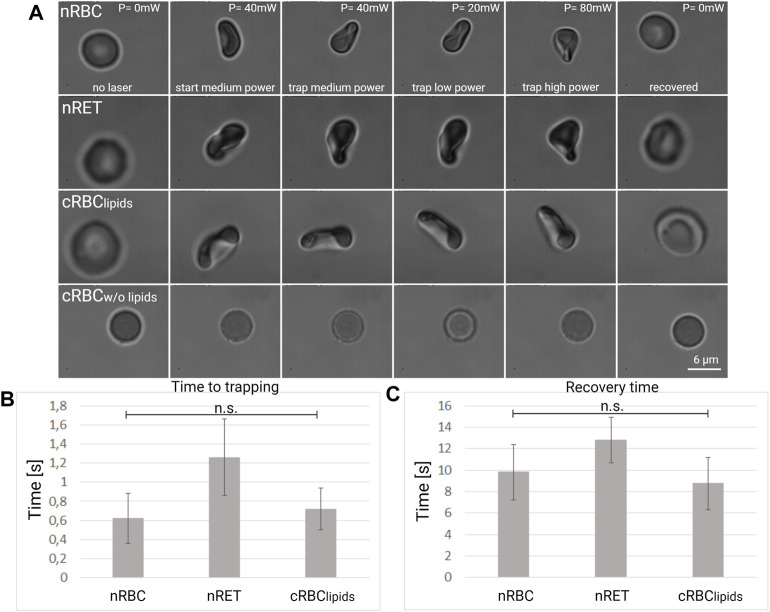
FIGURE 4.
Cell deformation under optical forces. (A) Representative images of nRBC, nRET, and cRBC cell deformation under optical forces generated by the laser beam at low, medium and high power. The graph below shows a comparison of (B) time to trapping and (C) recovery time in seconds between nRBC (n = 27), nRET (n = 23) and cRBClipids (n = 25) in the optical trap. The graphs show the mean and the standard deviation.

