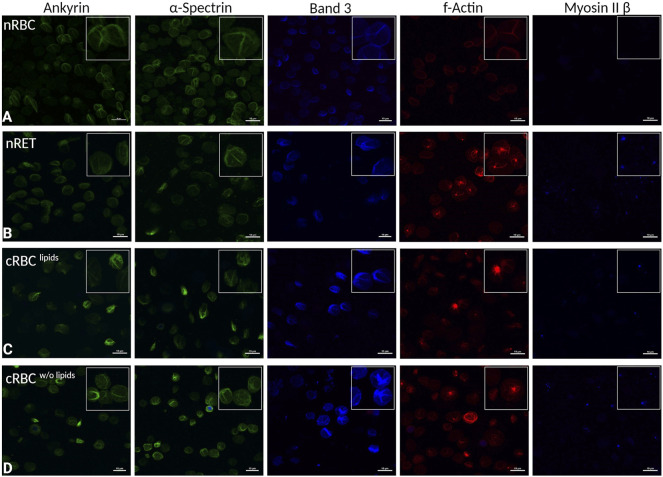
FIGURE 5.
Immunocytochemistry. Representative fluorescence microscopy images of immunocytochemically stained cytoskeletal and membrane proteins from left to right: ankyrin, α-spectrin, band 3, F-actin, and myosin IIβ in (A) nRBC, (B) nRET (C) cRBClipids and (D) cRBCw/o lipids (scale bars are 10 µm). In each of the images, there is a magnified section to show details of cells. All images are representative images of n > 25 per cell type.

