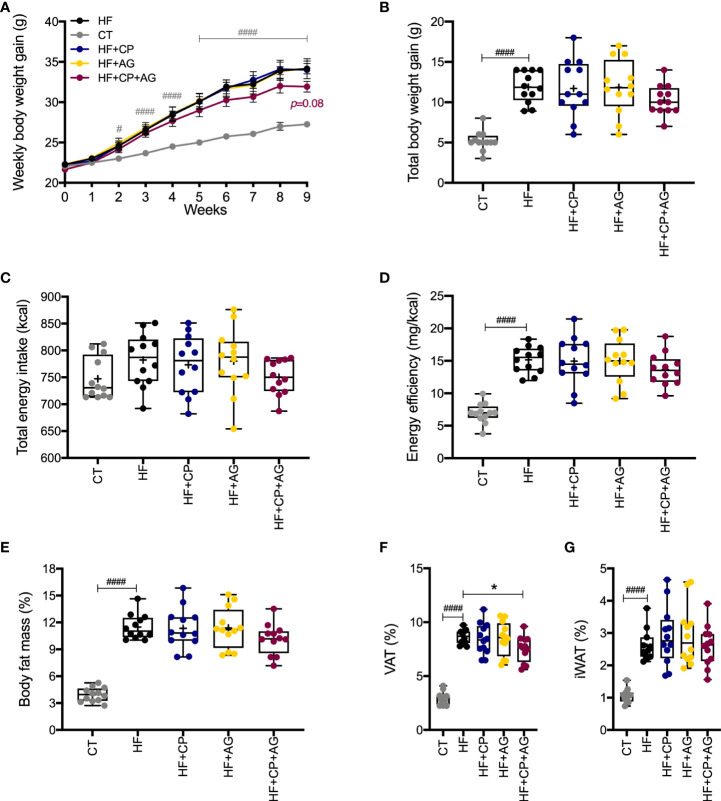
Figure 1.
Cranberry polyphenol + agavin effects in body weight gain and body fat mass in HFHS-fed mice. (A) Weekly body weight gain expressed in grams gained by male C57BL/6 mice consuming the indicated diets for the 9-week intervention period. (B) Total body weight gain in grams at the end of week 9. (C) Total energy intake in kilocalories (kcal). (D) Energy efficiency corresponding to the ratio of body weight in milligrams (mg) to energy intake in kilocalories (mg/kcal). (E) Percentage (%) of body fat mass expressed relative to body weight at 9 weeks. (F) Percentage (%) of visceral adipose tissue (VAT%), represented by the sum of retroperitoneal white adipose tissue (rpWAT) + epididymal white adipose tissue (eWAT). (G) Percentage of inguinal white adipose tissue (IWAT%). CT — chow diet. HF — high-fat high-sugar diet. HF+CP — high-fat high-sugar diet and cranberry polyphenols. HF+AG — high-fat high-sugar diet and agavins. HF+CP+AG — high-fat high-sugar diet and the combination of CP+AG. Two-way repeated-measure ANOVA (RM two-way ANOVA) with Dunnett’s multiple-comparison test (post-hoc test) was employed to calculate the significance between groups at different time points. One-way ANOVA with a Dunnett’s multiple-comparison test (post-hoc test) was employed to calculate the significance of the differences between groups. Values are expressed as the mean ± SEM (n = 12). Boxplots represent the distribution of data with the mean represented by the mark “+” within the boxes, the median represented by the dark horizontal line and interquartile range by the box, *p < 0.05 as compared to the HFHS-control group. #p < 0.05; ###p < 0.001. Chow-control group versus HFHS-control group.

