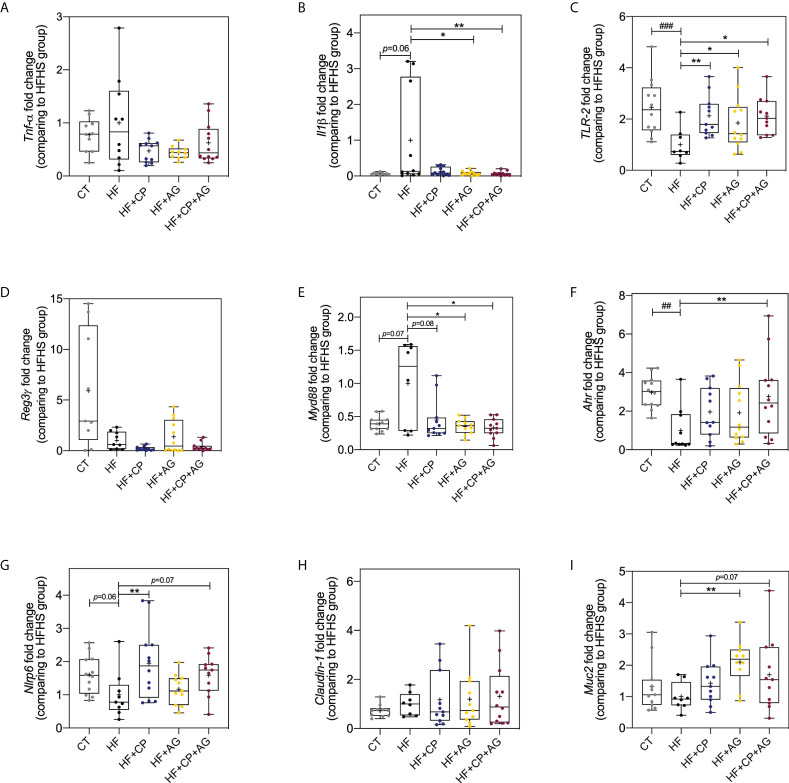
Figure 7.
Effects of cranberry polyphenols and agavins in the relative expression of genes linked to the control of gut epithelial barrier function and inflammation. The fold change of colonic gene expression relative to HFHS-fed mice (normalized to 1.0) of (A) tumor necrosis factor-alpha (Tnfα); (B) interleukin 1 beta (Il1β); (C) Toll-like receptor 2 (Tlr2); (D) regenerating islet-derived protein 3 gamma (Reg-3-γ); (E) myeloid differentiation primary response 88 (Myd88); (F) aryl hydrocarbon receptor (Ahr); (G) NOD-like receptor family pyrin domain containing 6 (Nlrp6); (H) Claudin-1; (I) Mucin 2 (Muc2). Relative gene expression was determined by RT-qPCR. Fold change was calculated using the ΔΔCT method; each gene was normalized to the expression level of the reference genes actin beta (Actb), peptidylprolyl isomerase B (Ppib), and hypoxanthine phosphoribosyltransferase (Hprt). Mice were fed either a chow diet (CT) or high-fat high-sugar diet (HF); mice on a HF-diet were supplemented with CP (HF+CP), AG (HF+AG), or the combination of both CP+AG (HF+CP+AG) for 9 weeks. Boxplots represent the distribution of data with the mean represented by the mark “+” within the boxes, the median represented by the dark horizontal line and interquartile range by the box. Ordinary one-way ANOVA was performed to calculate the significance of the differences between groups. *p < 0.05, **p < 0.01 compared to the HFHS-control group. ##p < 0.01; ###p < 0.001 chow-control group versus HFHS-control group.

