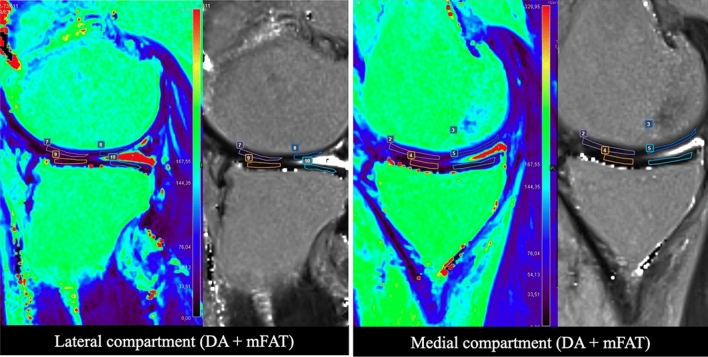
Fig. 4.
Representative MRI image for patients in AD + mFAT group. T2 mapping evaluation in a 49-year-old male patient treated with AD + mFAT and diagnosed with an MRI Outerbridge grade III at tibio-femoral joint. Regions of interest positioning on both tibia and femur (ROIs) is showed on the lateral side of the knee (left image) and medial side (right image), with corresponding native mapping image used to properly locate the ROIs. T2-mapping values range from 0 to 329.95

