
FIGURE 1.
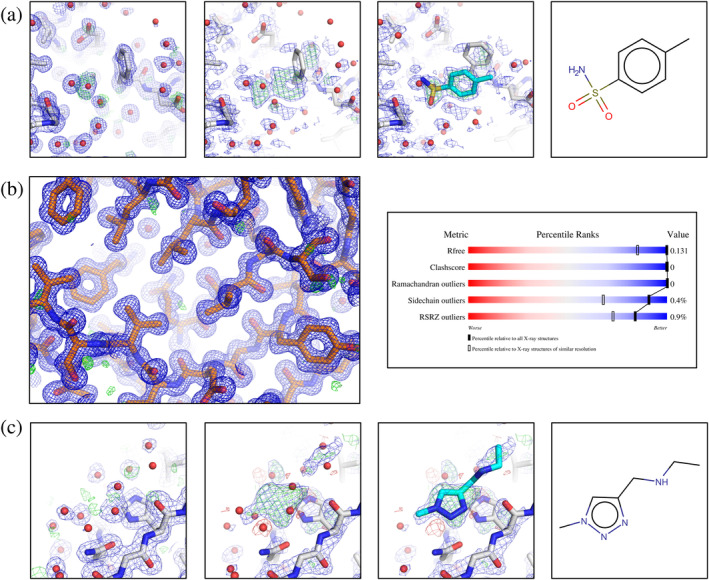
(a) Ligand identification for PDB‐Id 5RTL. Left panel: the auto‐refined model from the intermediate DIMPLE 18 step is shown along with the corresponding electron density maps: the (2mFo‐DFc) map contoured at 1.0σ (blue) and the (mFo‐DFc)‐difference map contoured at 3.0σ (green/red). This panel is similar to fig. 1a of Jaskolski et al. 1 Middle panels: PanDDA Z‐map (contoured at Z = 3, green/red) and PanDDA event map contoured at 1.0σ (blue), along with the auto‐refined model and the ligand placed, respectively. The PanDDA event map coefficients are available from the PDB in the deposition's structure factor CIF. Right panel: chemical structure of the ligand, ZINC388056. (b) PDB‐Id 5RDH after reprocessing. Left panel: auto‐refined model and (2mFo‐DFc) map, contoured at 1.0σ (blue), (mFo‐DFc)‐difference map contoured at 3.0σ (green/red). (c) Ligand identification for PDB‐Id 5RFB. Left panel: the auto‐refined model from the intermediate DIMPLE 18 step (D Fearon and F von Delft, personal communication) is shown along with the corresponding electron density maps: the (2mFo‐DFc) map contoured at 1.0σ (blue) and the (mFo‐DFc)‐difference electron density map contoured at 3.0σ (green/red). This panel is similar to fig. 1c of Jaskolski et al. 1 Middle panels: The PanDDA Z‐map (contoured at Z = 3, green/red) (D Fearon and F von Delft, personal communication) and the PanDDA event map (available from the PDB under PDB‐Id 5RFB) contoured at 1.0σ (blue), along with the auto‐refined model and the ligand placed (=bound state) model, respectively. Right panel: chemical structure of the ligand, Z1271660837