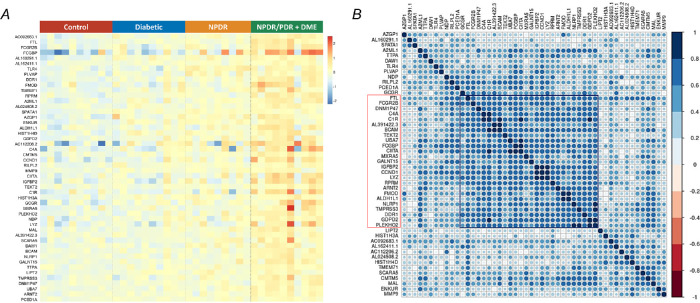
Figure 2.
Expression profile and correlation analyses of severity-associated genes. (A) A heatmap of the expression level of 50 severity-associated genes in all samples across different groups, adjusted for gender and age. (B) Heatmap of the correlation matrix across 50 severity-associated genes. Pearson's correlation was calculated among the severity-associated genes to show the co-expression patterns of genes in the heatmap. Color key denotes the Pearson's correlation coefficient between genes. There is one clear cluster (highlighted in red and black) of severity-associated genes with a strong positive correlation, adjusted by gender and age.

