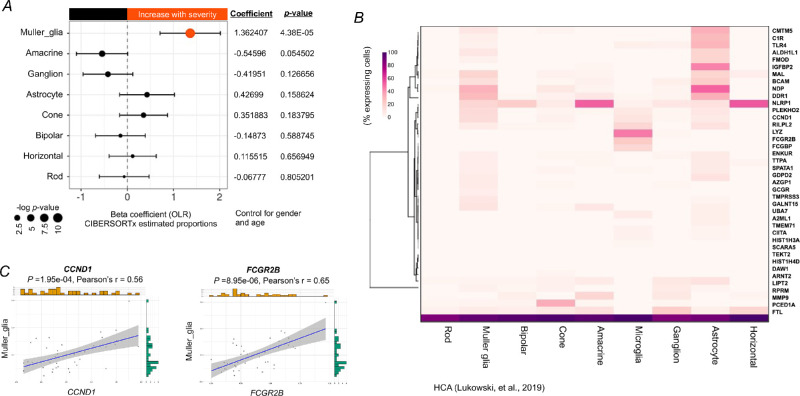
Figure 5.
The cellular landscape of the macula of patients with DR and its relation to severity-associated genes. (A) Forest plot of estimated proportions of retinal cells having a significant correlation with the severity of DR (P < 0.05). Positive or negative coefficients indicate the proportion of retinal cells increases or decreases with the severity of DR, respectively. Statistical analyses of the correlation between the severity of DR and the proportions of retinal cells were assessed by a nonparametric ordinal logistic regression model, adjusted for gender and age. Point sizes are scaled by statistical significance. Error bars represent 95% confidence intervals. (B) Heatmap showing the percentage of retina cells expressing severity-associated genes (40 genes were found in the retinal scRNA-Seq dataset from the Human Cell Atlas), scaled by gene across the different cell types. (C) Analyses of the correlation between the expression level of CCND1 or FCGR2B and the estimated proportion of Müller glia, adjusted for gender and age. Pearson's correlation coefficient was used to test the strength of linear relationships between gene expression and the estimated proportion of Müller glia. Grey dots denote individual samples (n = 39). Blue lines denote regression lines.

