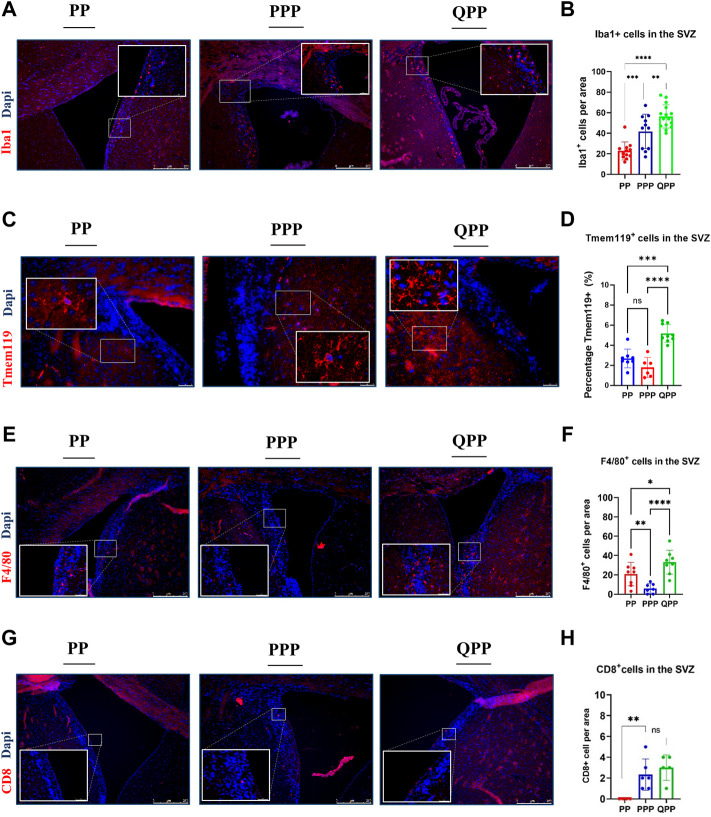
FIGURE 2.
Early premalignant lesions of the QPP mice demonstrated a tumor-permissive microenvironment compared to those of the PP and PPP mice (A). Immunofluorescence staining images of IBA1-positive myeloid cells in the SVZ regions of PP, PPP, and QPP brains, respectively. Scale bars represent 250 μm. (B). Quantification and comparison of IBA1-positive myeloid cell numbers between PP, PPP, and QPP premalignant SVZ regions. (C). Immunofluorescence staining images of TMEM119-positive microglia in the SVZ regions of PP, PPP, and QPP brains, respectively. Scale bars represent 50 μm. (D). Quantification and comparison of TMEM119-positive area percentages between PP, PPP, and QPP premalignant SVZ regions. (E). Immunofluorescence staining images of F4/80-positive macrophages in the SVZ regions of PP, PPP, and QPP brains, respectively. Scale bars represent 250 μm. (F). Quantification and comparison of F4/80-positive macrophage numbers between PP, PPP, and QPP premalignant SVZ regions. (G). Immunofluorescence staining images of CD8-positive lymphocytes in the SVZ regions of PP, PPP, and QPP brains, respectively. Scale bars represent 250 μm. (H). Quantification and comparison of CD8-positive lymphocyte numbers between PP, PPP, and QPP premalignant SVZ regions. (Two-way ANOVA, ns = not significant, * = p < 0.05, ** =p < 0.01, *** = p < 0.001, and **** = p < 0.0001).

