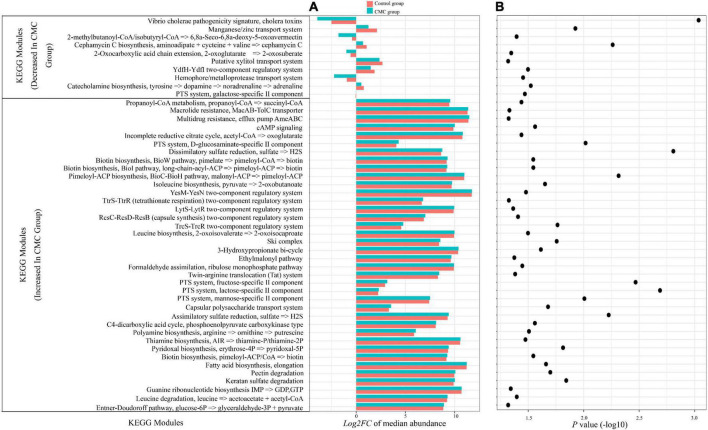
FIGURE 6.
CMC alters the functional potential of the gut microbiome. (A) Microbial genes annotated to Kyoto Encyclopedia of Genes and Genomes (KEGG) orthologs (KOs). The bar chart displays the log2 fold change of the relative abundance median of all individual KOs within a module following the Control group (pink bars) or the CMC group (blue bars), respectively. (B) Dot plot of the negative log10 of the P-value from the Mann–Whitney test of KEGG module abundance of two groups.

