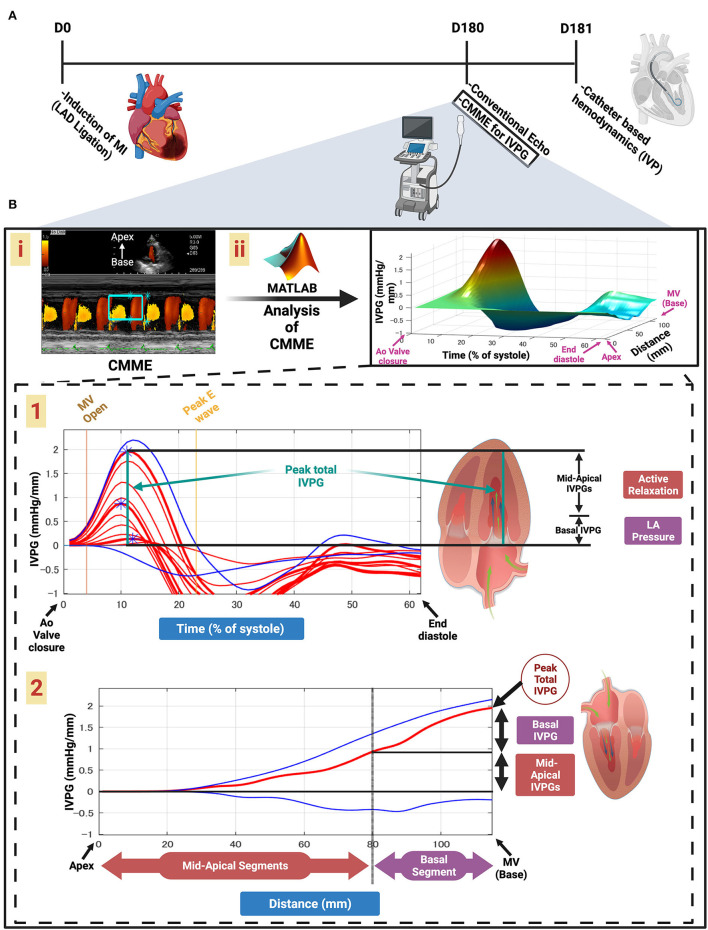
Figure 1.
Schematic illustration of this study design and calculation of IVPG. Timeline of the study (A). Color M-mode echocardiography (CMME) for intraventricular pressure gradient (IVPG) (B). Apical four-chamber view CMME to trace the inflow tract from the left atrium (LA) to the apex of the left ventricle (LV) with the cursor parallel to the mitral inflow (i). CMME analysis using MATLAB software and generation of the 3D temporal and spatial profiles of the IVPG using Euler's equation over a percent of time of systolic duration from the complete closure of the aortic valve to the end of diastole. The z-axis is the distance (mm) from the apex to the mitral valve (base) (ii). Two-dimensional graph of the temporal profile of the IVPG over % of systole from the aortic valve closure to the end of diastole showing the peak total IVPG and segmental IVPGs, respectively (1). Two-dimensional spatial profile of the IVPG from the apex to the base (MV) of the heart. The red line represents the spatial profile at peak total IVPG that often happens at the level of the MV. The top and the bottom blue lines represent the inertial and the convective IVPG, respectively. Calculation of the basal and mid-apical segmental IVPGs relied on the rule of LV segmentation (one-third for basal and two-thirds for mid-apical) (2).

