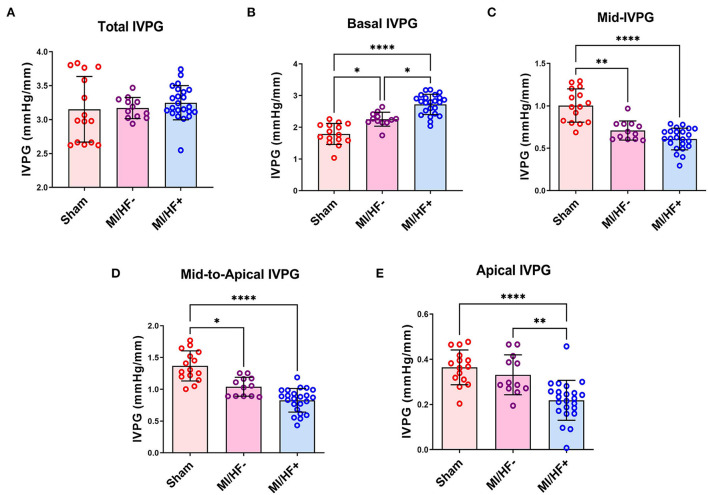
Figure 3.
Scatter plots with bars of the IVPG indices in different groups. Data presented as mean ± SD. The total IVPG showed no significant change among different study groups (A). Basal IVPG was significantly increased in MI/HF– and MI/HF+ groups compared to the Sham one (B). The mid-IVPG (C) and the mid-to-apical IVPG (D) presented a significant decline in MI/HF– and MI/HF+ groups compared to the Sham group. The apical IVPG decreased significantly in the MI/HF+ group compared to the other groups (E). *p < 0.05, **p < 0.01, and ****p < 0.0001.

