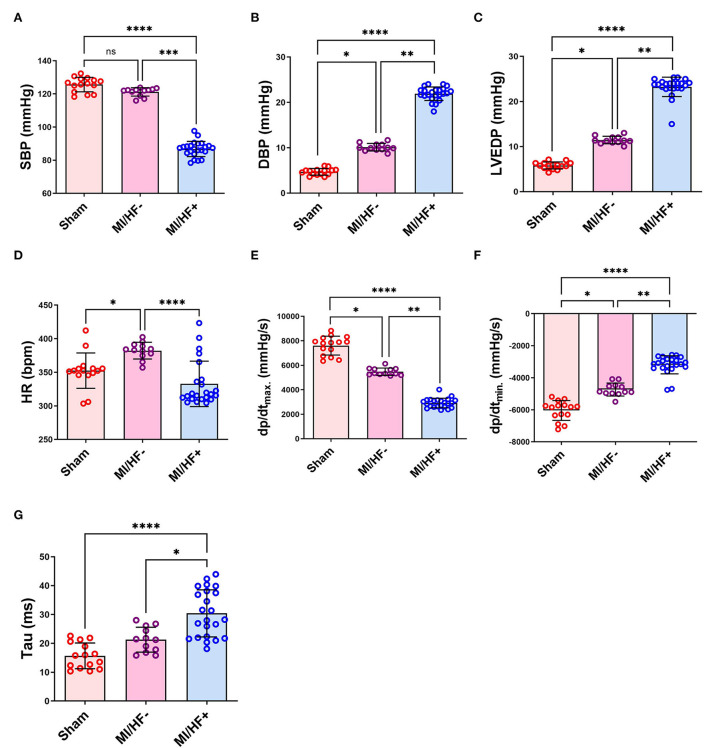
Figure 4.
Scatter plots with bars presenting a quantitative comparison of various hemodynamic parameters in different groups including systolic blood pressure (SBP) (A), diastolic blood pressure (DBP) (B), left ventricular end-diastolic pressure (LVEDP) (C), heart rate (HR) (D), positive left ventricular pressure derivative (dP/dtmax.) (E), negative left ventricular pressure derivative (dP/dtmin.) (F), and time constant of isovolumic relaxation (Tau) (G). Data presented as mean ± SD. *p < 0.05, **p < 0.01, ***p < 0.001, and ****p < 0.0001.

