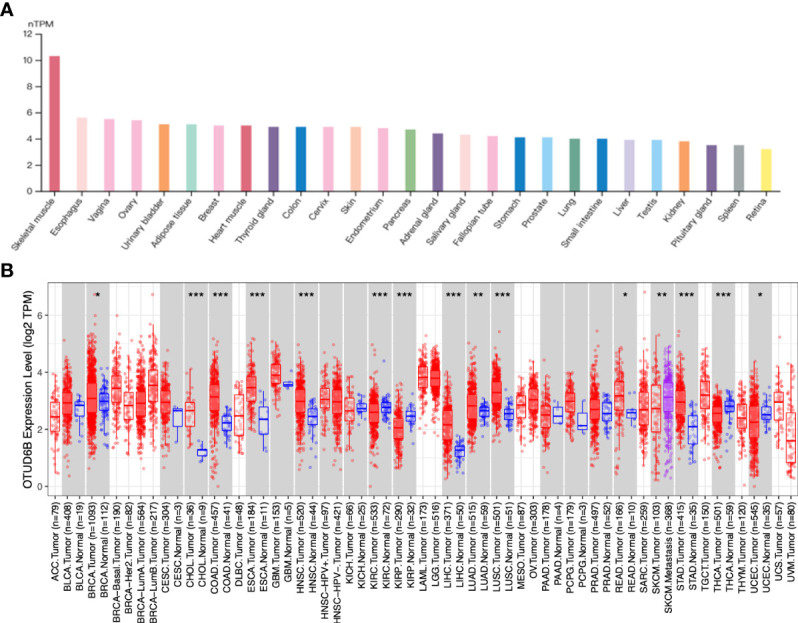
Figure 1.

OTUD6B expression in various tissues and tumors. (A) The level of OTUD6B in different normal tissues from the HPA database. (B) The expression differences of OTUD6B between normal and tumor tissues from the TIMER database. (*p < 0.05; **p < 0.01; ***p < 0.001).
