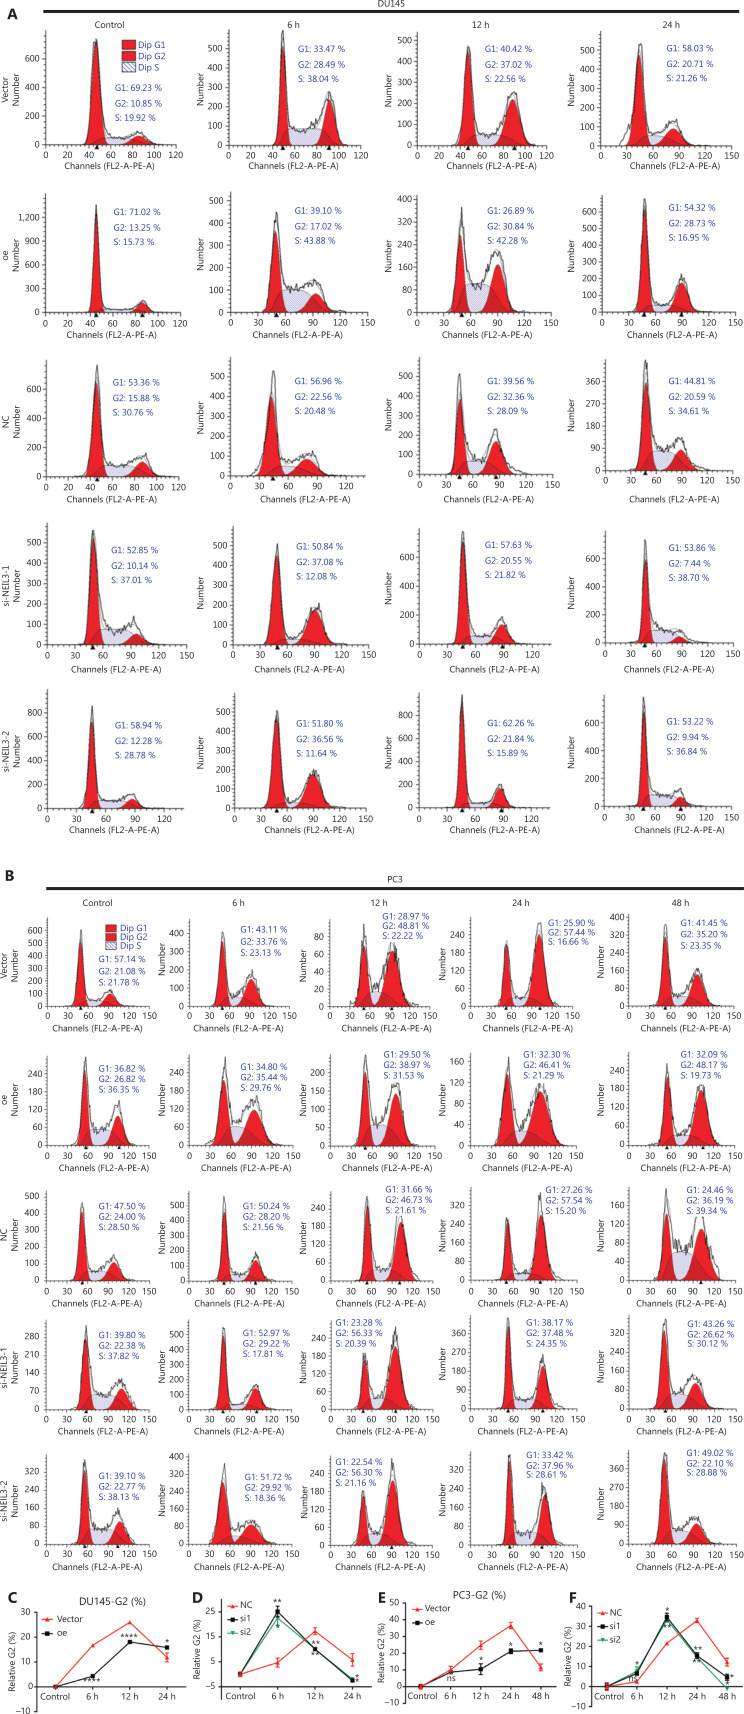
Figure 5.
NEIL3 promotes radiotherapy sensitivity by regulating the cell cycle. (A and B) Representative flow cytometry cell cycle images of DU145 (A) and PC3 (B) cells before and 6 h, 12 h, and 24 h after radiotherapy. (C–F) Relative G2-phase change curves of NEIL3 overexpression (C, E) or knockdown (D, F) in DU145 and PC3 cell lines; *P < 0.05, **P < 0.01, and ****P < 0.0001, versus the corresponding time point vector or NC group.

