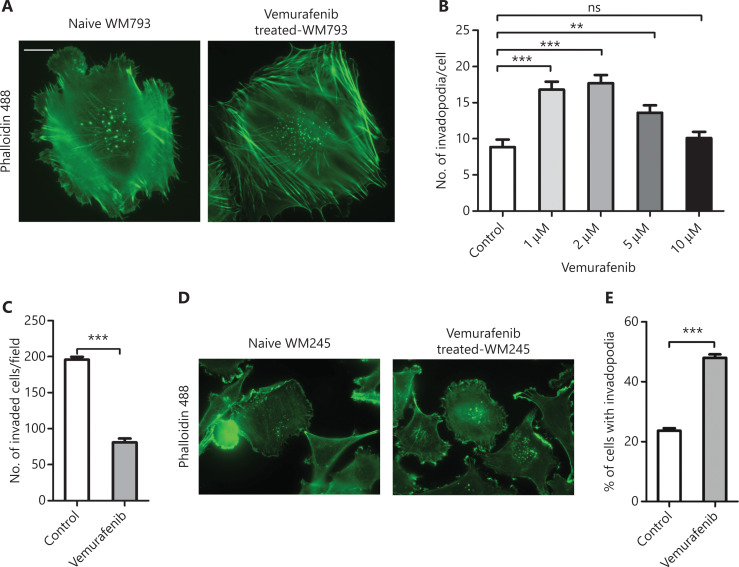
Figure 2.
Vemurafenib triggers the formation of invadopodia. (A) Representative images of actin fluorescence staining showing invadopodia in WM793 cells. Scale bars = 10 μm. (B) Quantitation of invadopodia in WM793 cells treated with different concentrations of vemurafenib. (C) Quantitation of invaded WM793 cells treated with and without vemurafenib. (D) Representative images of actin fluorescence staining of invadopodia in WM245 cells. (E) Quantitation of WM245 cells with invadopodia, treated with and without vemurafenib (n = 3). **P < 0.01; ***P < 0.001.

