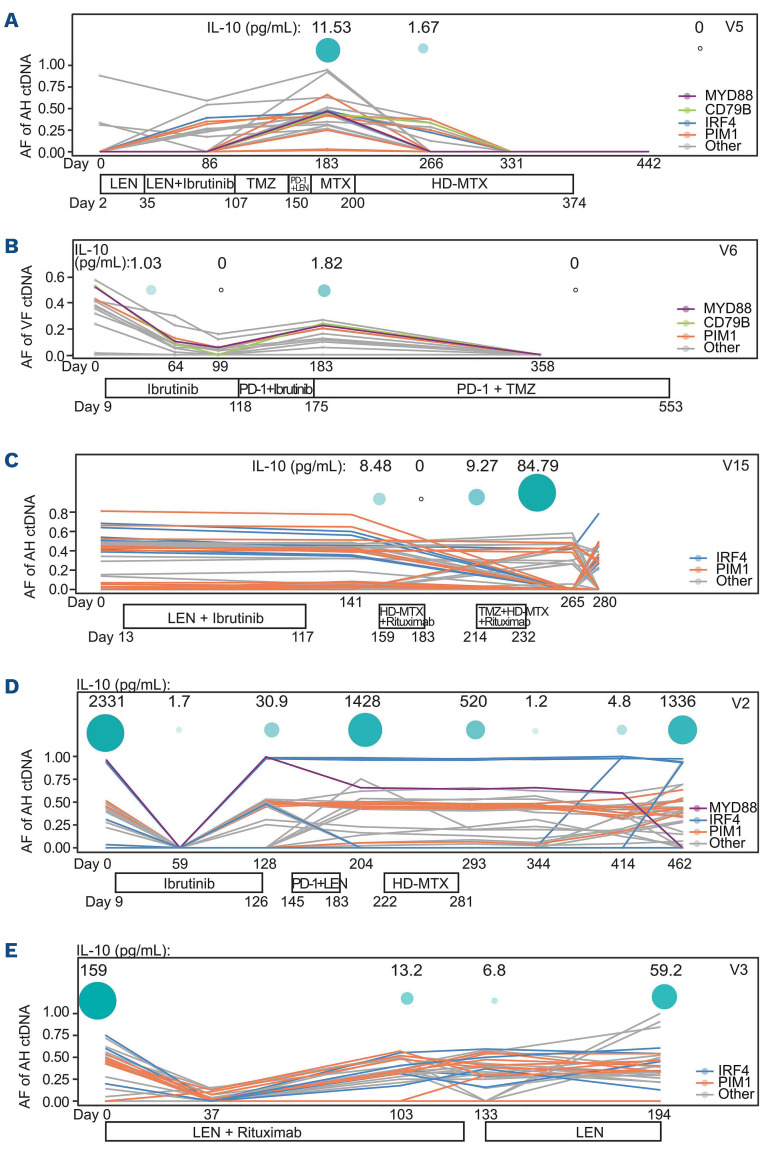
Figure 3.
Dynamic profiling of circulating tumor DNA and interleukin-10 levels in aqueous humor or vitreous fluid samples. The treatment histories of five patients (identity numbers in the top right corner of each panel) with dynamic and sequential sampling of aqueous humor (AH) or vitreous fluid (VF) are shown at the bottom of each panel. The allele frequency changes to driver mutations and other alterations are shown in the line chart. Interleukin-10 levels (pg/mL) at each time point are indicated by the green circles at the top of each panel. AF: allele frequency; ctDNA: circulating tumor DNA; IL-10: interleukin.10; LEN: lenalidomide; TMZ: temozolomide; HD-MTX: high-dose methotrexate.

