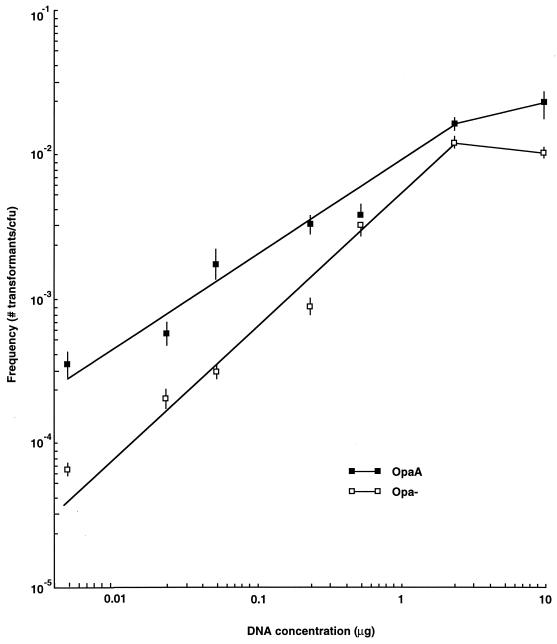
FIG. 1.
Transformation efficiency versus donor DNA concentration. OpaA and Opa-negative bacteria were transformed with various amounts of donor DNA. Each data point represents the mean transformation efficiency value at that DNA concentration ± standard error (n = 6). Frequencies are presented as the number of drug-resistant transformants per CFU.

