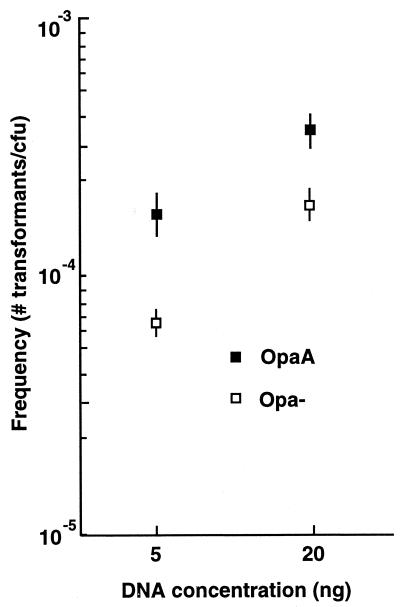
FIG. 2.
Transformation of mixed OpaA and Opa-negative populations at low DNA concentrations. OpaA and Opa− bacteria were mixed prior to the addition of the donor DNA, with the percentage of Opa+ and Opa− bacteria in each population being scored on the basis of colony opacity following microscopic evaluation. The data presented are mean transformation efficiencies ± standard errors (n = 6).

