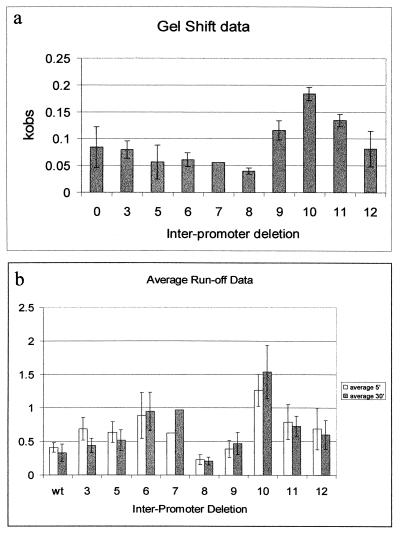
FIG. 2.
Activity of the pRM promoter is maximal for a 10-bp deletion in the region separating pRM and pR in both electrophoretic mobility shift and runoff transcription assays. The x-axis represents the number of base pairs deleted between the −35 regions of pR and pRM. (a) Comparison of the average kobs for open complex formation at pRM for each of the promoter variants. The radioactivity in each band, as a percentage of the total in the lane, was plotted against the time of incubation with the RNAP, and the kobs for each DNA was determined by fitting the data to the equation y = Yf · {1 − exp[−(t) · kobs]} + Yo, where y = the percent of open complexes formed, t = time after RNAP mixing, and Yf and Yo are the limiting values for y. (b) Data from runoff transcription assays. The y-axis is the ratio of the band intensity for transcription derived for the pRM promoter compared to the total density of the lane. The empty bars represent the relative amounts of RNA transcribed after incubating the RNAP with promoter for 5 min, while the solid bars represent the relative amounts of RNA synthesized after a 30-min preincubation.

