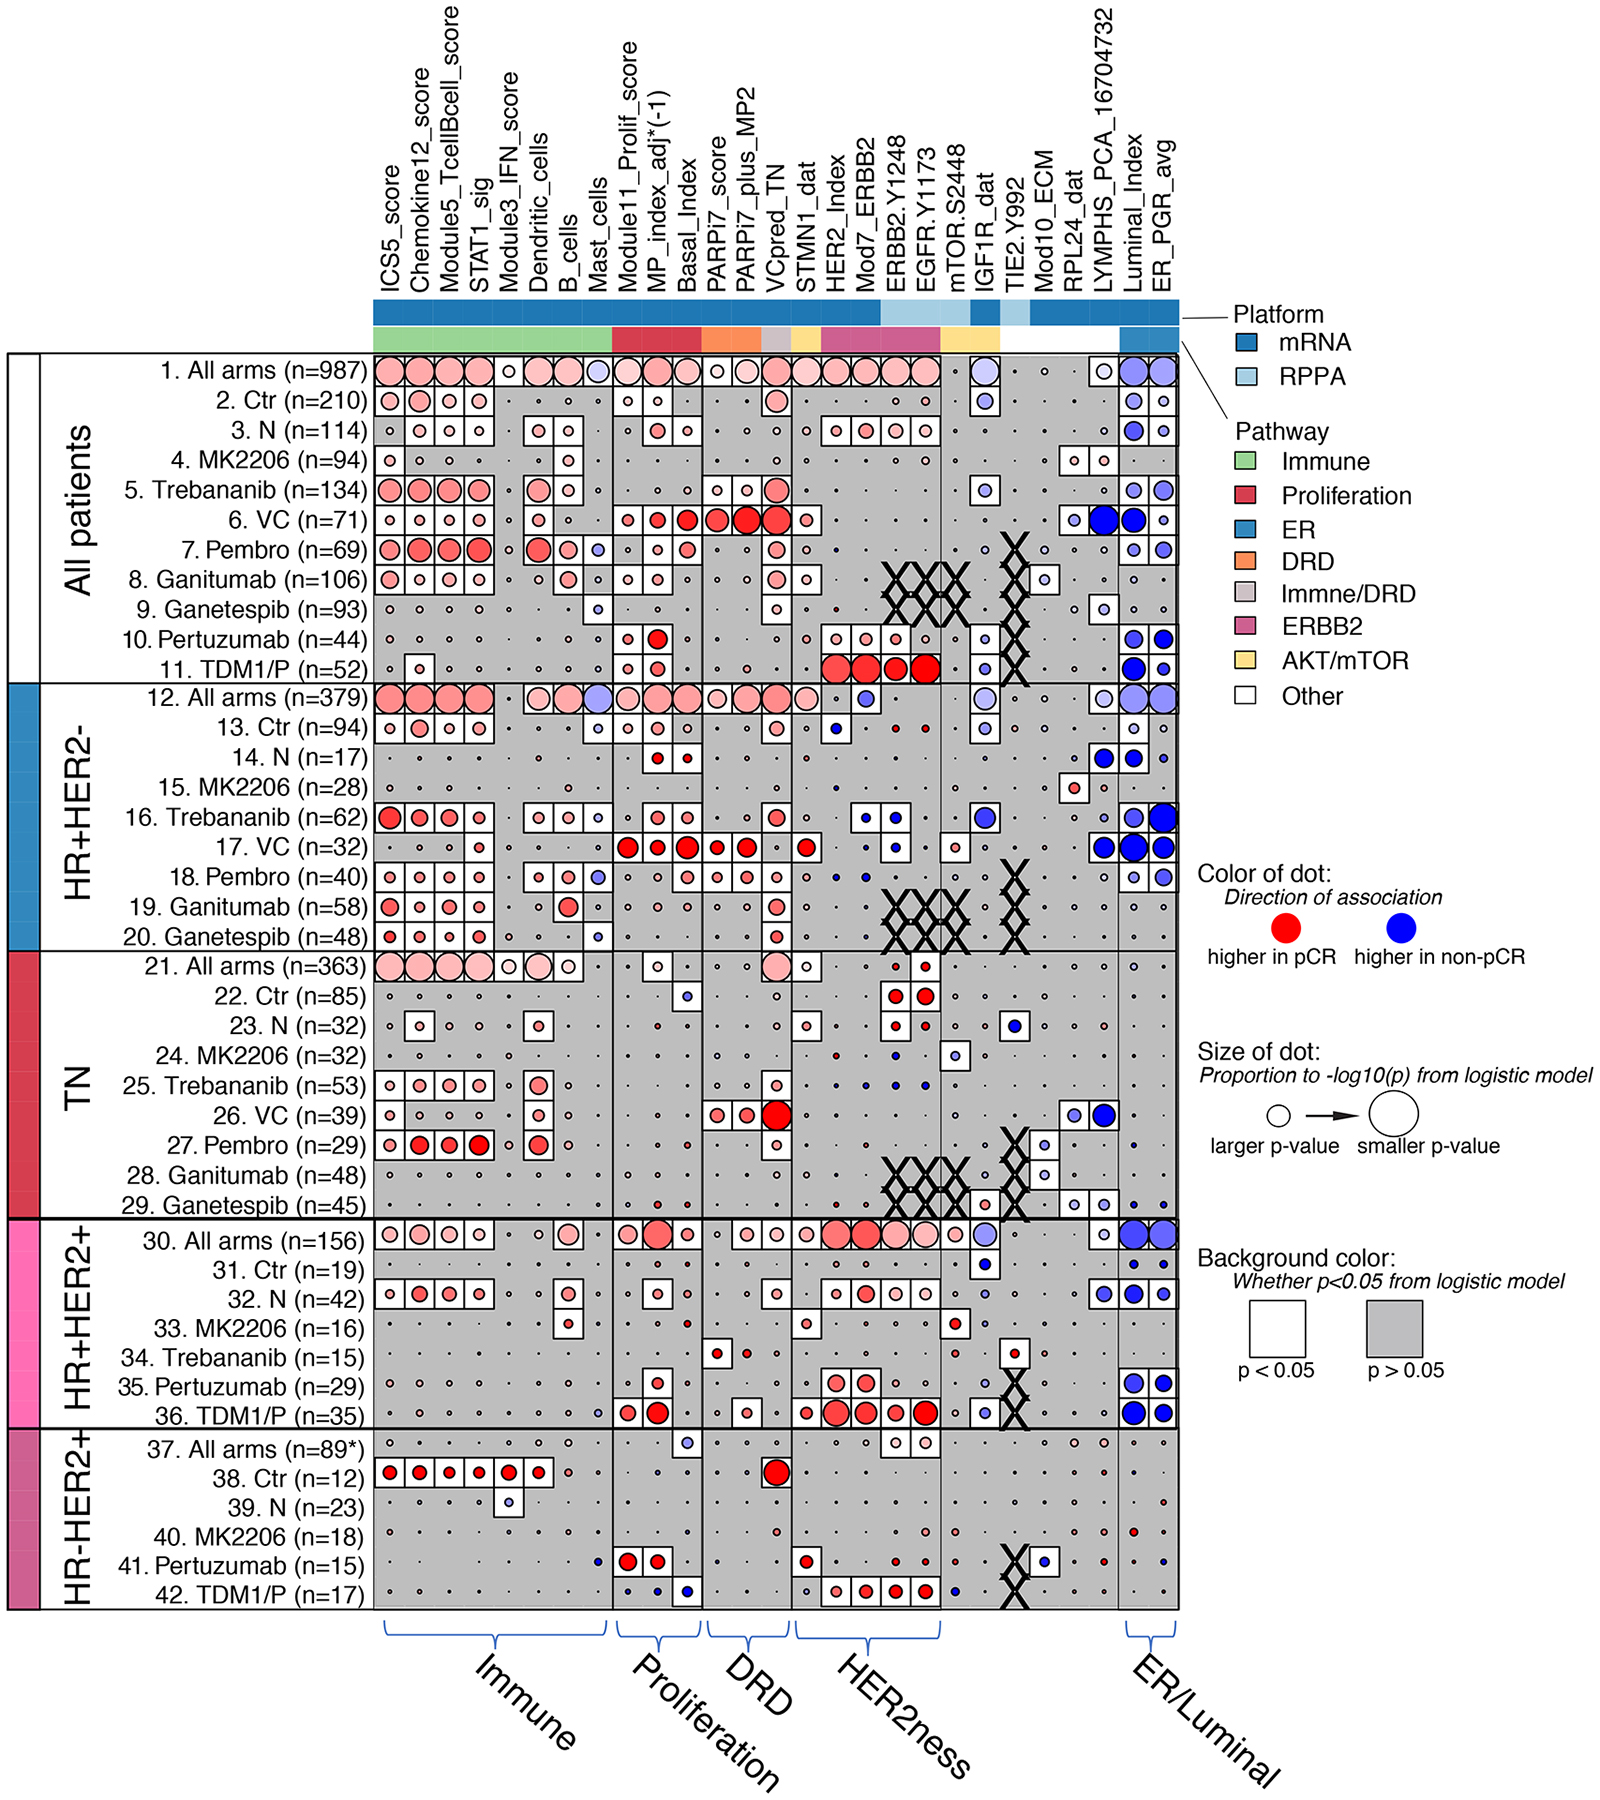
Figure 3. pCR association analysis of continuous mechanism-of-action biomarkers across 10 arms.

Dot-plot showing the level and direction of association between each signature (column) and pCR as labeled (rows): All patients (rows 1–11), HR+HER2− (rows 12–20), TN (rows 21–29), HR+HER2+ (rows 30–36) and HR-HER2+ (rows 37–42). Row labels denote treatment arm. Red/blue dot indicates higher/lower levels associate with pCR; darker intensity reflects larger effect size; size of dot reflects strength of association (1/p); white background indicates LR p<0.05; X denotes missing data. See also Table S3 and Figure S1.
