
Figure 7. Impact of subtyping schema on minimum required efficacy of new agent (HER2low example).
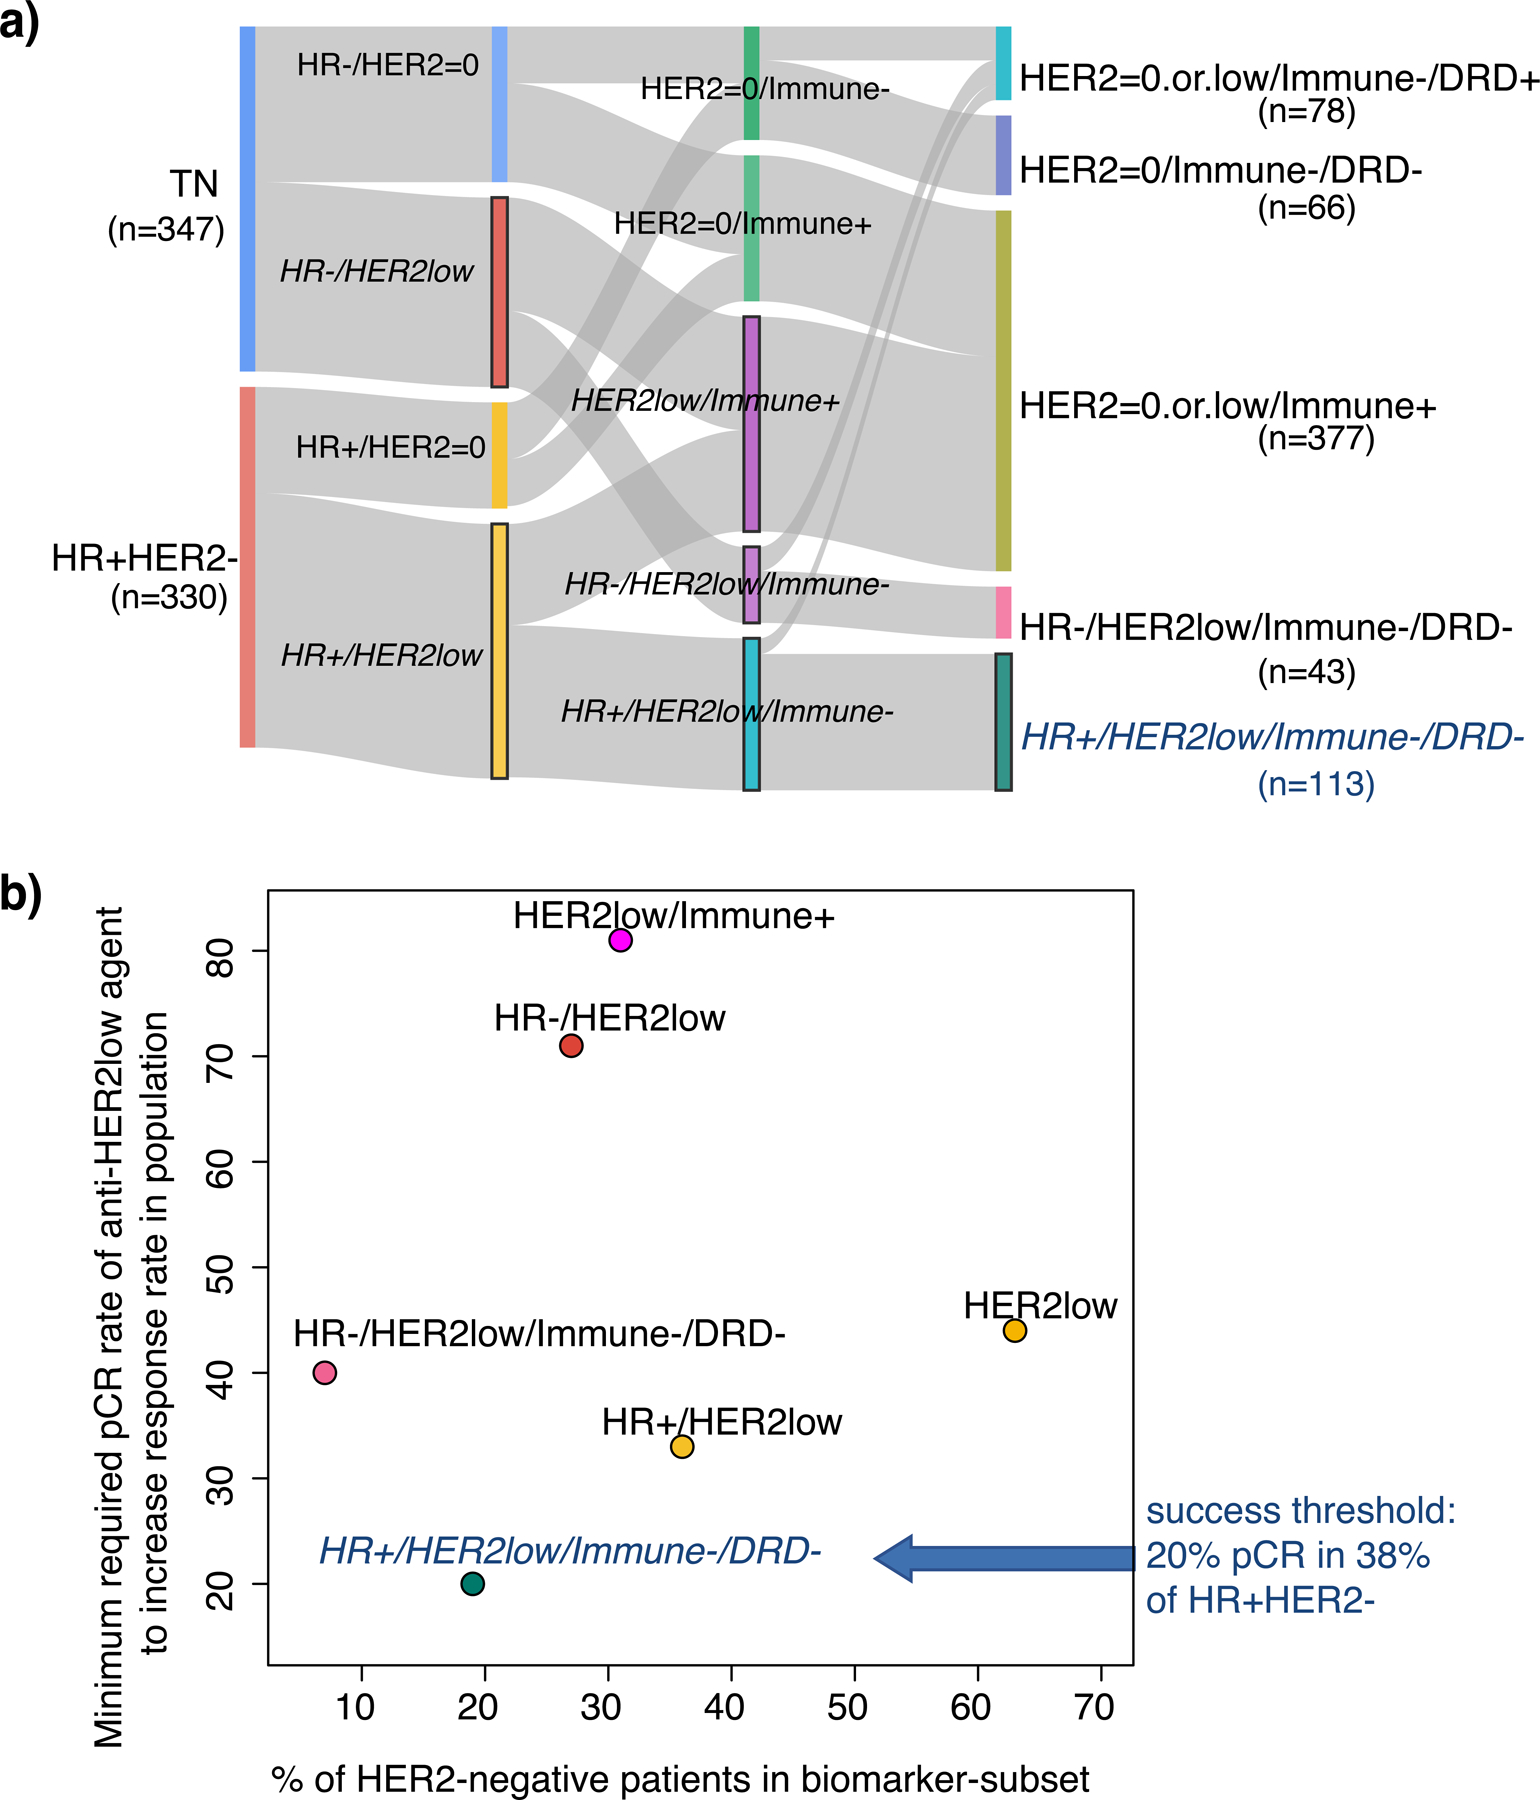
a) Sankey plot showing a variety of ways to combine HER2low status with HR and Immune/DRD. b) Scatter plot showing prevalence of HER2low subsets (x-axis) vs. the minimum pCR rate required for an anti-HER2low agent to equal that of the I-SPY2 agent with the highest response (minimum efficacy; y-axis).