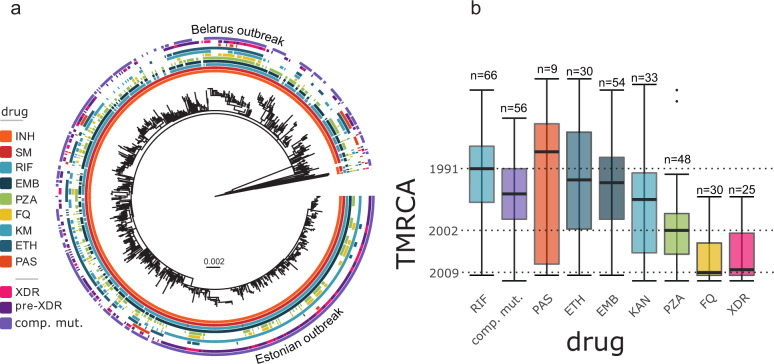
Fig. 3. Antibiotic resistance profiles and emergence timing.
a Bayesian time tree based on 5264 variable positions (SNPs) among the 720 W148 strains and 11 lineage 2 outgroup strains. The different crowns are showing the presence (filled box) or absence (empty box) of mutations conferring resistance to different drugs: INH Isoniazid, SM Streptomycin, RIF Rifampicin, EMB Ethambutol, PZA Pyrazinamide, FQ Fluoroquinolones, KM Kanamycin, ETH Ethionamide and PAS Para-aminoslicylic acid; strains drug resistance profiles: XDR, Pre-XDR and carrying putative rpoB compensation. b Box plot representing the emergence time of different antibiotic resistances. Highlighted dates indicate emergence of rifampicin resistance on top of pre-existing isoniazid resistance and thus MDR-TB (1991), pyrazinamide resistance (2002), fluoroquinolone resistance and XDR-TB (both 2009). Solid bars indicate median node ages, boxes represent the inter quartile range (IQR), whiskers extend to 1.5× IQR, outliers are shown as individual points.

