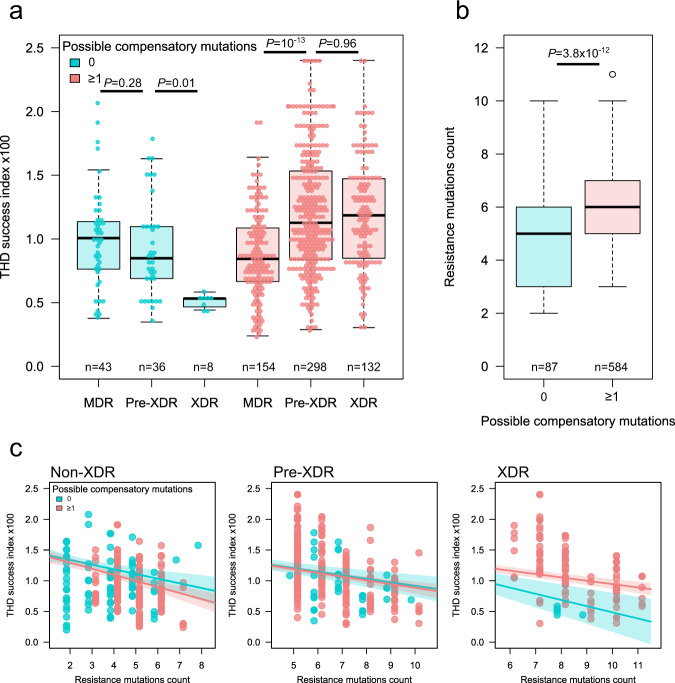
Fig. 5. Compensatory mutations influence the epidemic success of drug-resistant variants of W148 M. tuberculosis.
Whole genome sequences of 671 isolates were used to infer the presence of possible compensatory mutations and to compute indices of epidemic success using the THD method with a 10 y time scale. a Evolution of success indices with resistance status (MDR, and pre-XDR, XDR according to definitions in place in 2020) in isolates with and without possible compensatory mutations. The median success index decreased with resistance status in isolates lacking compensatory mutations and increased in isolates harboring these mutations. Solid bars indicate the median, boxes represent the inter quartile range (IQR), whiskers extend to 1.5× IQR. b The no. of resistance-conferring mutations per genome was higher in isolates harboring compensatory mutations. Solid bars indicate the median, boxes represent the inter quartile range (IQR), whiskers extend to 1.5× IQR, outliers are indicated by individual points. c The success indices decreased with the accumulation of resistance-conferring mutations within MDR, pre-XDR and XDR isolates. Colored lines and bands denote success indices (point estimate and 95% confidence interval, respectively) predicted by a linear model adjusted for population structure. In XDR, but not MDR and pre-XDR isolates, compensatory mutations were associated with a two-times slower decrease of success index per additional resistance mutation. All P values derived from two-sided Mann–Whitney U-tests.

