FIGURE 2.

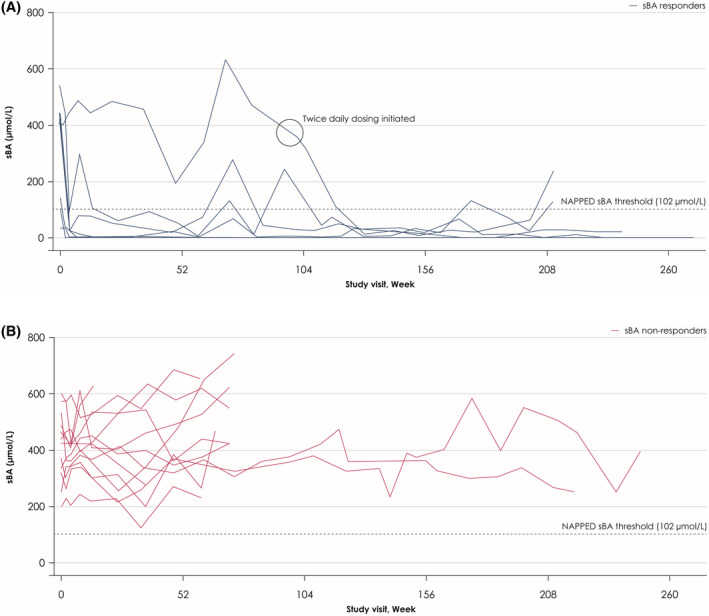
Individual changes from baseline to Week 240 in serum bile acid (sBA) levels in sBA responders (A) and sBA nonresponders (B). The black circle in Figure 2A indicates when the seventh responder initiated twice‐daily dosing at Week 97

Individual changes from baseline to Week 240 in serum bile acid (sBA) levels in sBA responders (A) and sBA nonresponders (B). The black circle in Figure 2A indicates when the seventh responder initiated twice‐daily dosing at Week 97