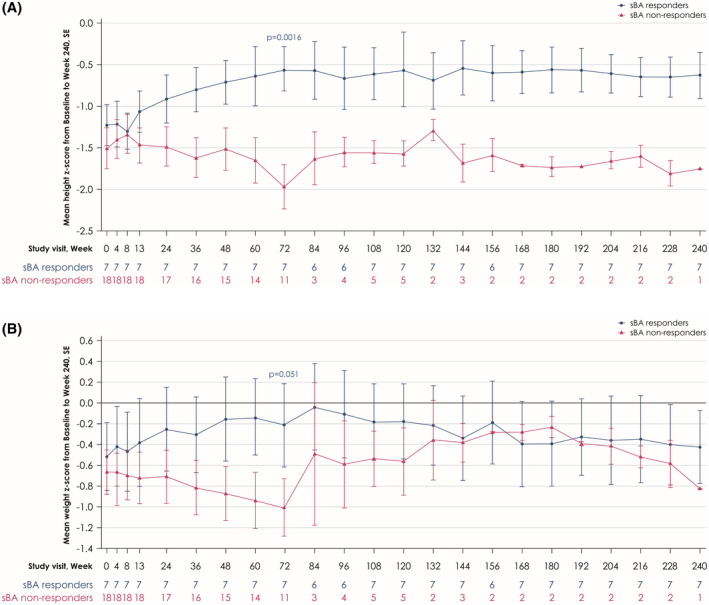
FIGURE 3.

Mean changes in height z scores (A) and weight z scores (B) from baseline to Week 240 in sBA responders and sBA nonresponders

Mean changes in height z scores (A) and weight z scores (B) from baseline to Week 240 in sBA responders and sBA nonresponders