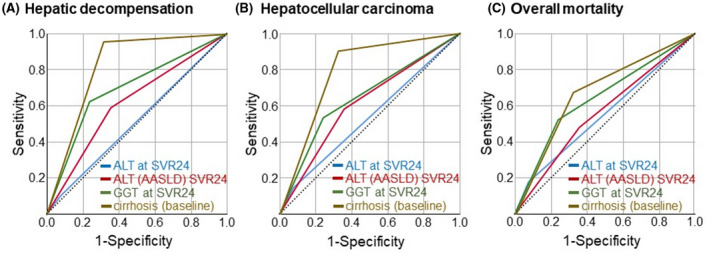
FIGURE 2.

ROC curve analyses of liver enzymes after direct‐acting antiviral treatment for clinical endpoints. ROC curves were plotted to assess the predictive power of posttreatment (SVR24) liver enzymes in patients infected with HCV from the German hepatitis C Registry for (A) hepatic decompensation, (B) hepatocellular carcinoma, and (C) overall mortality. Blue, ALT at SVR24; red, ALT (AASLD criteria) at SVR24; green, GGT at SVR24; brown, cirrhosis (at baseline); dashed line, reference line (0.5). AASLD, American Association for the Study of Liver Diseases; ALT, alanine aminotransferase; GGT, gamma‐glutamyltransferase; HCV, hepatitis C virus; ROC, receiver operating characteristic; SVR24, sustained virologic response at 24 weeks.
