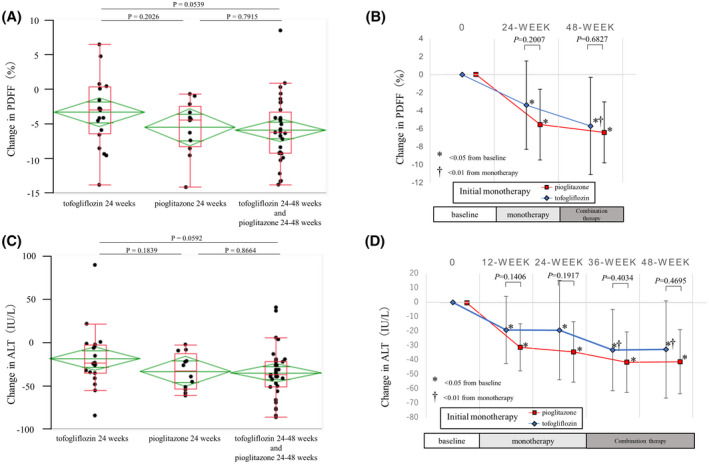
FIGURE 2.

Changes in intrahepatic fat content and liver tests. (A) Magnetic resonance imaging proton density fat fraction (MRI‐PDFF) changes compared between baseline and tofogliflozin monotherapy, pioglitazone monotherapy, and combination of tofogliflozin and pioglitazone. (B) Change in MRI‐PDFF after 24 weeks and 48 weeks of monotherapy and combination therapy, listed by initial monotherapy. (C) Alanine transaminase (ALT) level changes compared between baseline and tofogliflozin monotherapy, pioglitazone monotherapy, and combination of tofogliflozin and pioglitazone. (D) Change in ALT levels after 12 weeks (monotherapy), 24 weeks (monotherapy), 36 weeks (combination therapy), and 48 weeks (combination therapy), listed by initial monotherapy
