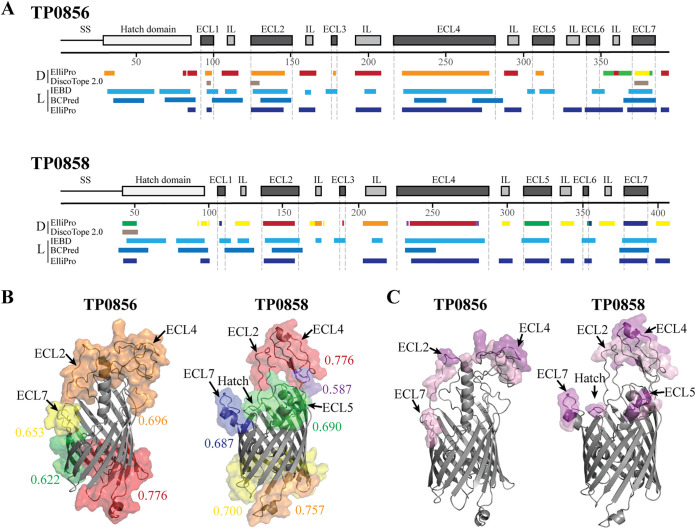
FIG 5.
B-cell epitope predictions of TP0856 and TP0858. (A) Cartoon schematics of TP0856 and TP0858 showing the positions of discontinuous (D) and linear (L) BCE predictions using ElliPro (32), DiscoTope 2.0 (31), IEDB (33), and BC pred (34) algorithms. (B) Ribbon diagrams (gray) of TP0856 and TP0858 with discontinuous BCEs predicted by ElliPro (threshold: 0.5) shown as transparent surfaces. Numeric values indicate the average prediction scores for corresponding epitopes. (C) Epitopes with scores ≥0.8 and ≥0.9 are shown as pink and magenta transparent surfaces, respectively.

