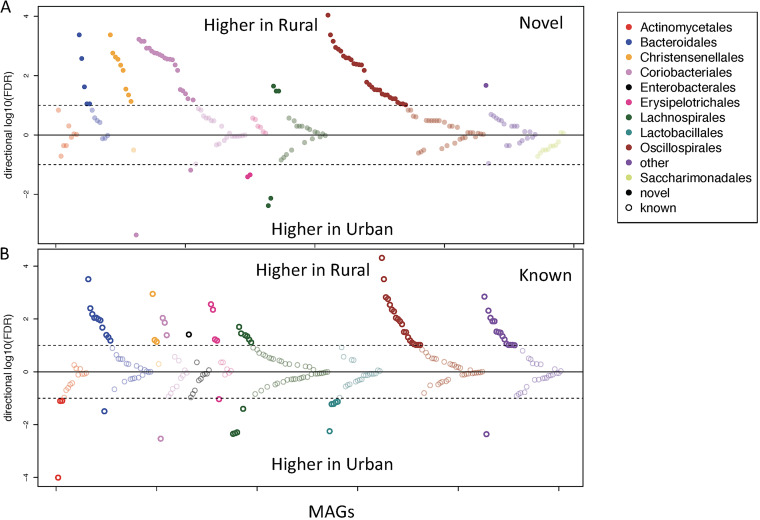
FIG 4.
Taxonomic distribution of novel and known species-level OTUs associated with urbanization. Each point is a species-level OTU, and the y axis shows the log10 of false-discovery rates (FDRs) multiplied by the direction of association as shown in the figure. The dotted line indicates a 10% FDR. The significance was analyzed with Wilcoxon test, and the OTUs were colored based on their order classification (Wilcoxon test, FDR < 0.1).

