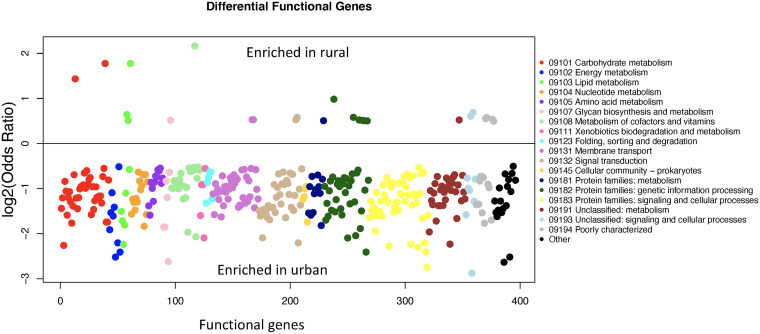
FIG 5.
Differential functional genes between metagenome assembled genomes (MAGs) from rural and urban participants. The association of functional genes and urbanization was analyzed with Fisher’s exact test. Each point is a differential functional gene, and the y axis shows the log2 of odds ratio as shown in the figure. The P values were adjusted with the Benjamini-Hochberg method. Significance was determined with an FDR cutoff of 0.1. The genes were colored by their KEGG pathways.

