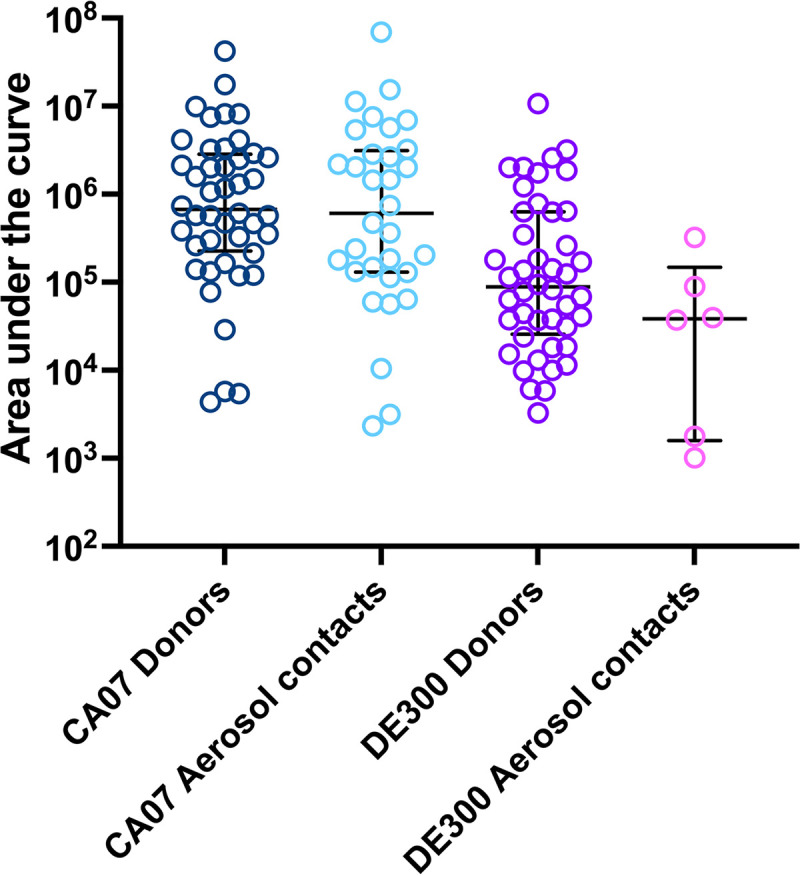
FIG 2.

Area under the curve of infectious viral loads detected from inoculated donors or infected contacts. Data points represent AUC values from individual ferrets from which infectious virus was detected. **, P < 0.01; ****, P < 0.0001 (Mann-Whitney test).
