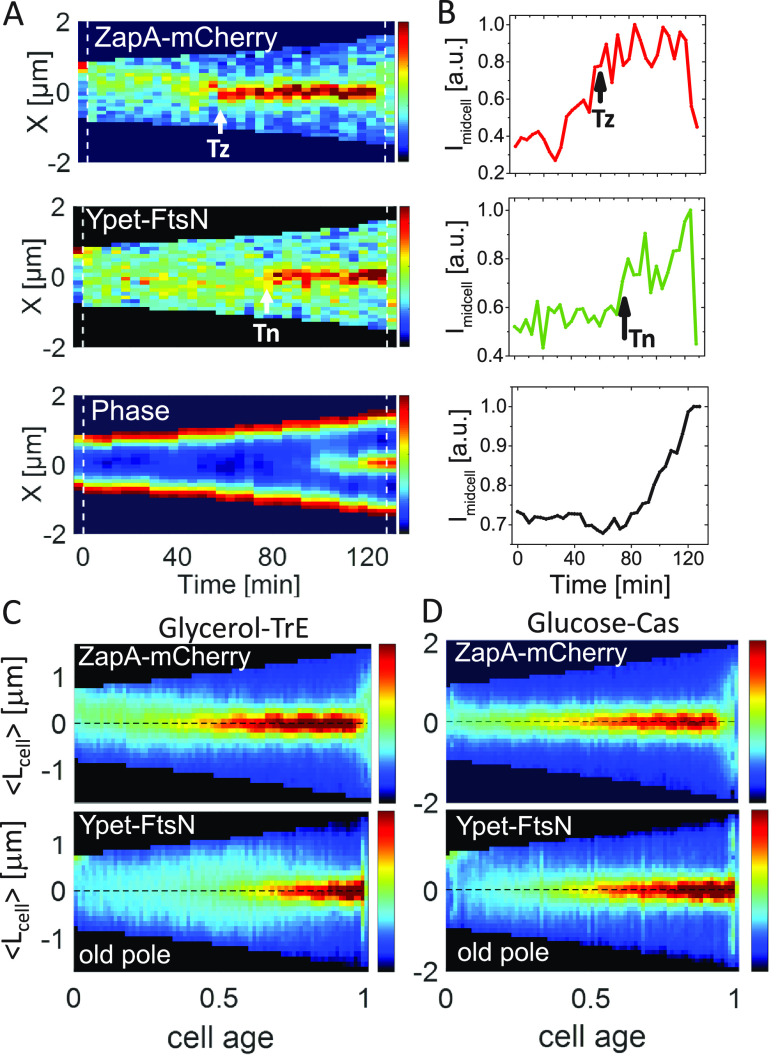
FIG 1.
Accumulation of ZapA and FtsN at midcell. (A) Kymographs of fluorescent and phase signals for a representative cell grown in M9 glycerol-TrE medium. Red corresponds to high- and blue to low-intensity values. Black marks regions outside the cell. Dashed vertical lines indicate cell division events. The arrows indicate event timings as determined by an automated algorithm (see Text S1). The timing of the persistent Z ring is denoted by Tz and the onset of FtsN recruitment by Tn. (B) Midcell intensity traces of ZapA-mCherry (top), Ypet-FtsN (middle), and phase signal (bottom) for the cell shown in the kymograph. The intensity traces were collected from about a 0.5 μm wide band in the cell middle. No cell background was subtracted from these traces. a.u., arbitrary unit. (C and D) Population averaged kymographs of ZapA-mCherry and Ypet-FtsN signals in M9 glycerol-TrE (N = 339) and glucose-cas (N = 526) media, respectively. All cells are aligned so that their old pole is at the bottom of the graph. The dashed horizontal line shows the midline of the cell. For further details, see Text S1.

