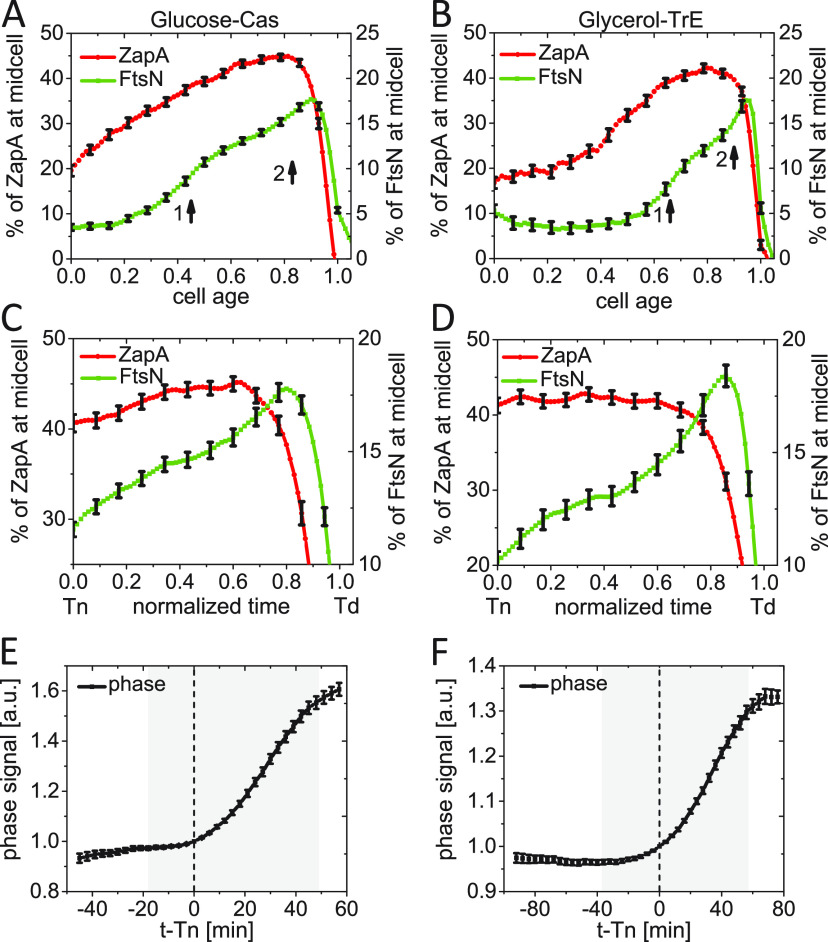
FIG 4.
Constriction starts at the first distinct stage of FtsN recruitment. (A and B) The excess fraction of ZapA-mCherry (left axis) and Ypet-FtsN (right axis) at midcell as a function of cell age for (A) moderately fast-growing (glucose-cas media, N = 526), and (B) slow-growing cells (glycerol media, N = 339). Arrows show the approximate start of stages 1 and 2 based on local maxima in the slope of the curve (Fig. S4A and B). (C and D) The same as in (A and B) but zooming in a shorter time interval from Tn to Td. The normalized time is defined as (Time − Tn)/(Td − Tn). (E and F) Phase signal intensity at midcell as a function of time from FtsN recruitment at midcell for (E) moderately fast-growing and (F) slow-growing cells. Time zero corresponds to Tn (indicated by a dashed vertical line). The shaded area marks the region where the number of cells analyzed is no less than 10% of its maximal value. All error bars correspond to 95% confidence intervals (for clarity, only every fifth point is shown in panels A to D).

