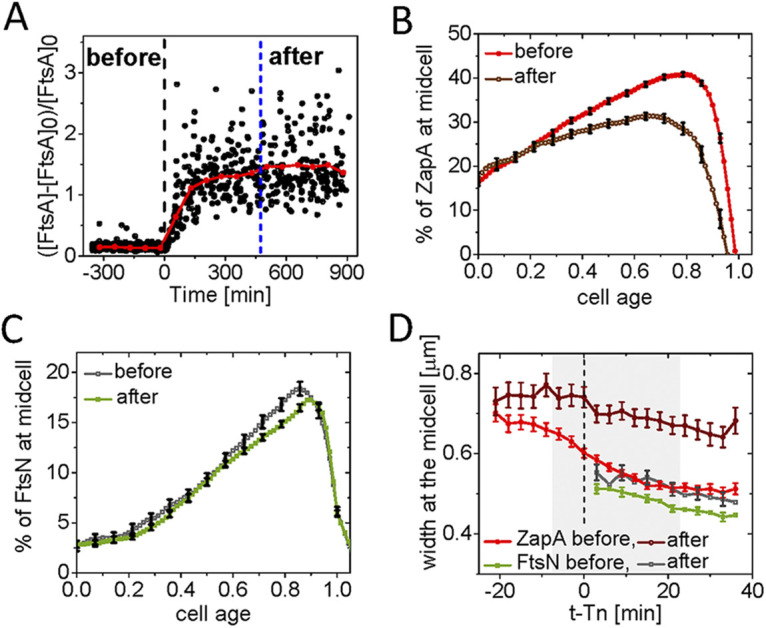
FIG 5.

Changes in FtsN and ZapA midcell accumulations upon FtsA overexpression. (A) Relative increase in the concentration of FtsA, [FtsA], at cell birth before and after induction with 100 μM IPTG as inferred from monitoring GFP reporter expressed from pDSW210 (strain JM149). The shown increase is relative to WT FtsA concentration, [FtsA]0, which is determined by Western blotting. Time zero (black dashed vertical line) corresponds to the start of the induction. N = 1,470. (B) The excess fraction of ZapA-mCherry at midcell before and after overexpression of FtsA as a function of cell cycle time. For cells termed “after,” ZapA amounts were analyzed when the cell growth reached a new steady-state (indicated by a blue vertical dashed line in panel A). Cells were grown in M9 glucose-cas media. The error bars represent 95% confidence intervals (for clarity, only every fifth point is shown). N = 660 (before); N = 223 (after). (C) The excess fraction of Ypet-FtsN at midcell before and after overexpression of FtsA as a function of cell cycle time. Conditions as above for ZapA-mCherry in (B). (D) The width of ZapA-mCherry and Ypet-FtsN accumulations at midcell as a function of time before and after overexpression of FtsA. Midcell traces of ZapA-mCherry and Ypet-FtsN were aligned at the time of FtsN recruitment at midcell, t − Tn = 0, is marked by a dashed line. The shaded area marks the region where the number of cells analyzed does not vary more than 10%. The error bars represent 95% confidence intervals (for clarity, only every second point is shown for FtsN).
