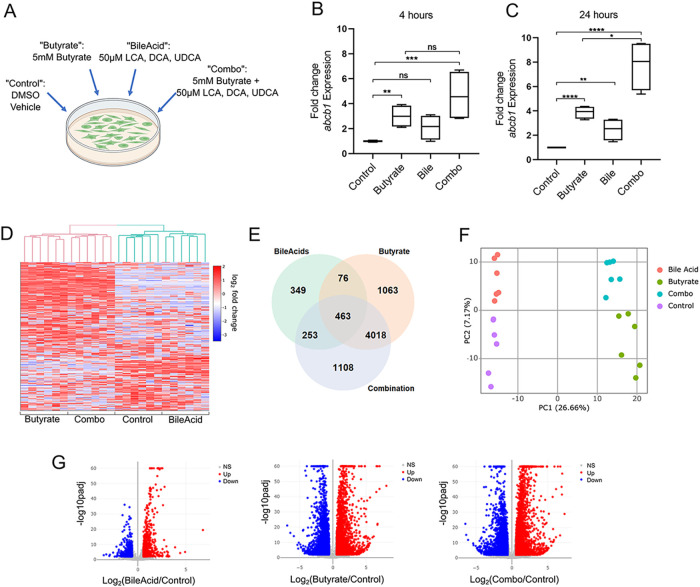
FIG 1.
Butyrate and secondary bile acids together induce a unique transcriptional profile. (A) Diagram of treatment of T84 cells with butyrate, LCA, DCA, and/or UDCA, made with BioRender. (B) and (C) T84 cells were incubated with butyrate, LCA, DCA, and/or UDCA, as described in (A) for 4 h (B) or 24 h (C) prior to RNA collection and qPCR analysis for abcb1 expression. Pooled data from two independent experiments; ns P > 0.05; *, P < 0.05; **, P < 0.01; ***, P < 0.001; ****, P < 0.0001 one-way ANOVA with Tukey’s multiple-comparison test. (D-G) RNAseq analysis of T84 cells incubated with butyrate, LCA, DCA, and/or UDCA as described in (A) for 4 h. (D) Heat map showing relative expression of top 500 genes with genes in rows and six biological replicates per group shown in columns. (E) Venn diagram showing number of genes differentially expressed in cells after each treatment (cut-off P < 0.01, fold change >1.5). (F) Principal-component analysis of top 500 differentially expressed genes. Points represent individual samples, colors represent treatment as indicated in the legend. (G) Volcano plot of log2(fold change) of each treatment versus control determined by DESEQ2 analysis, cut-off set to P < 0.01, fold change >1.5.

