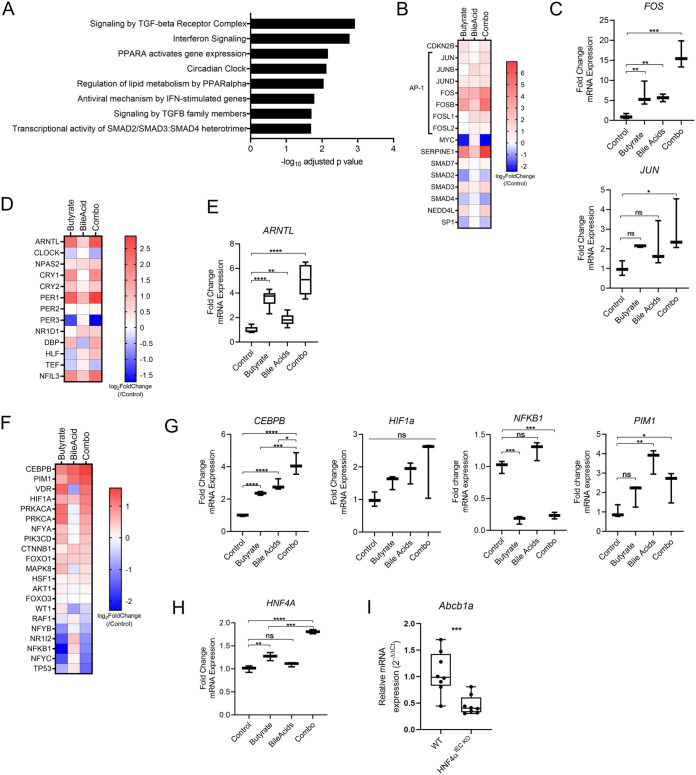
FIG 2.
Metabolite combination activates multiple pathways related to P-gp induction. (A) Pathways (Reactome) significantly and uniquely enriched in metabolite combination-treated T84 cells compared to butyrate- or bile acid-treated T84 cells, determined by g:Profiler analysis of RNAseq data (Fig. 1). (B) Heat map of RNAseq data showing relative expression of genes related to TGFβ signaling. (C) qPCR analysis of FOS and JUN expression in T84 cells treated with butyrate, bile acids or a combination for 4 h compared to DMSO control as in Fig. 1B (D) Heat map of RNAseq data showing relative expression of genes related to circadian clock signaling. (E) qPCR analysis of ARNTL expression in T84 cells as in (C). (F) Heat map of RNAseq data showing relative expression of genes related to P-gp regulation. (G) qPCR analysis of CEBPB, PIM1, HIF1a, and NFKB1 expression in T84 cells as in (C). (H) qPCR analysis of HNF4A expression in T84 cells as in (C). (C, E, G, H) Data are pooled from 3–6 biological replicates. ns P > 0.05; *, P < 0.05; **, P < 0.01; ***, P < 0.001; ****, P < 0.0001 by one-way ANOVA with Tukey’s multiple-comparison test. (I) qPCR analysis of Abcb1a expression in colon tissue of wild-type (WT) and intestinal epithelial knockout of HNF4α (HNF4αIEC KO). N = 8 per genotype, N = 4 female and N = 4 male mice. ***, P < 0.001 by unpaired t test.

