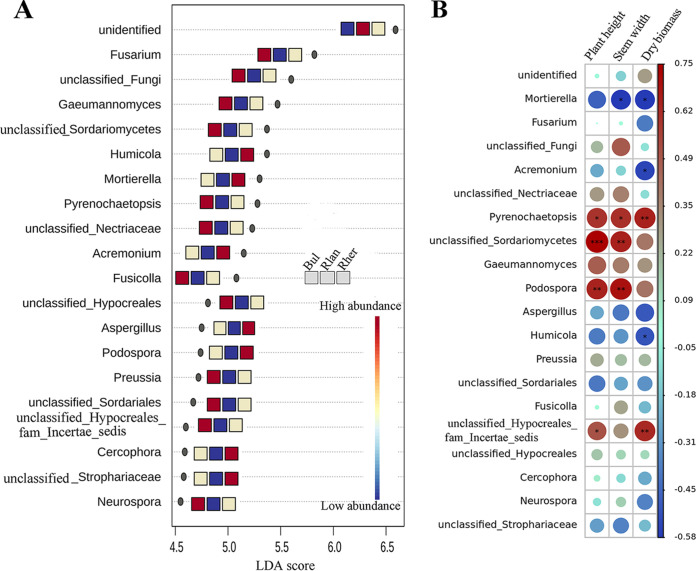
FIG 3.
The top-20 indicator genera among the spatial compartments identified by LEfSe (A). The color of the icons shows the relative abundance of these indicators, and the key from blue to red represents the least abundant to most abundant. The icons represent bulk soil (Bul), rhizoplane (Rlan), and rhizosphere (Rher) compartments in sequence from left to right. Spearman’s correlations between the relative abundances of these indicator genera on the rhizoplane and plant agronomic traits (i.e., including plant height, stem width, and plant dry biomass) (B). The color of the icons shows the magnitude of the correlations, and the key from blue to red represents the strongest negative correlations to strongest positive correlations. *, P < 0.05; **, P < 0.01; ***, P < 0.001.

