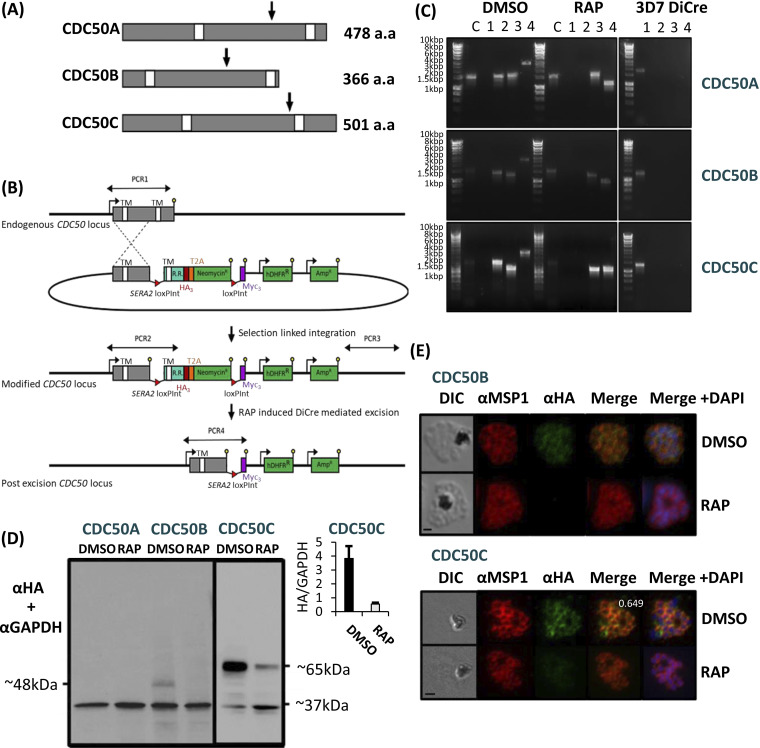
FIG 1.
(A) Representation of the three P. falciparum CDC50 proteins displayed from the N terminus to the C terminus. White boxes, transmembrane helices (TMDs) as predicted by TMHMM (59). Arrows indicate the point from which the protein products are truncated when the corresponding modified locus is excised in transgenically modified parasite lines. For CDC50A, this is from Phe341, for CDC50B from His235, and for CDC50C from Glu383. a.a, amino acids. (B) Schematic representation of the SLI strategy (58) used to produce the three CDC50 DiCre lines and resultant RAP-induced disruption of the modified genes. Double-headed arrows, regions amplified by PCR in panel C; red arrowheads, loxP sites; yellow lollipops, translational stop codons; white boxes, TMDs; light blue boxes, recodonized sequence (R.R.). (C) Diagnostic PCR analysis of gDNA from transgenic CDC50 parasite lines CDC50A-HA:loxP, CDC50B-HA:loxP, and CDC50C-HA:loxP verifying successful modification of target loci by SLI. Efficient excision of “floxed” sequences is observed in RAP treatment for all lines. Lane C represents amplification of a control locus (PKAc) to check gDNA integrity. PCRs 1 to 4 are represented in the schematic locus in panel B. PCR 1 screens for the WT locus, PCR 2 for 5′ integration, PCR 3 for 3′ integration, and PCR 4 for excision of the floxed sequence. See Table 1 for sequences of all primers used for PCR. Sizes of expected amplicons are as follows. C, control locus (primers 16 and 17), 1,642 bp. For CDC50A: PCR 1 (primers 21 and 22), 1,842 bp; PCR2 (primers 21 and 18), 1,613 bp; PCR3 (primers 20 and 22), 1,670 bp; and PCR 4 (primers 21 and 19), 2,863 bp (DMSO) and 1,169 bp (RAP). For CDC50B: PCR 1 (primers 23 and 24), 1,423 bp; PCR2 (primers 23 and 18), 1,457 bp; PCR3 (primers 20 and 24), 1,321 bp; and PCR 4 (primers 23 and 19), 2,707 bp (DMSO) and 1,010 bp (RAP). For CDC50C: PCR 1 (primers 25 and 26), 1,369 bp; PCR2 (primers 25 and 18), 1,602 bp; PCR3 (primers 20 and 26), 1,172 bp; and PCR 4 (primers 25 and 19), 2,852 bp (DMSO) and 1,369 bp (RAP). (D) Western blot analysis of expression (DMSO) and ablation (RAP) of CDC50A-HA, CDC50B-HA, and CDC50C-HA from highly synchronous late-stage schizonts in the respective transgenic parasite lines. Expression of GAPDH (PF3D7_1462800) is shown as a loading control. CDC50C-HA showed some residual expression after excision, but quantification shows an ~8-fold reduction in protein following RAP treatment (inset). No expression of CDC50A-HA was detected. Predicted molecular masses of CDC50B-HA, CDC50C-HA, and GAPDH are indicated. (E) IFA analysis showing diffuse peripheral localization of CDC50B-HA and CDCD50C-HA and loss of expression upon RAP treatment (16 h postinvasion). Over 99% of all RAP-treated CDC50B-HA:loxP and CDC50C-HA:loxP schizonts examined by IFA were diminished in HA expression in three independent experiments. Signals are representative of fields of view containing at least 10 parasites from three independent experiments. The inset number in the merge panel for DMSO represents the Pearson correlation coefficient for the HA and MSP1 signals. Scale bar, 2 μm.

