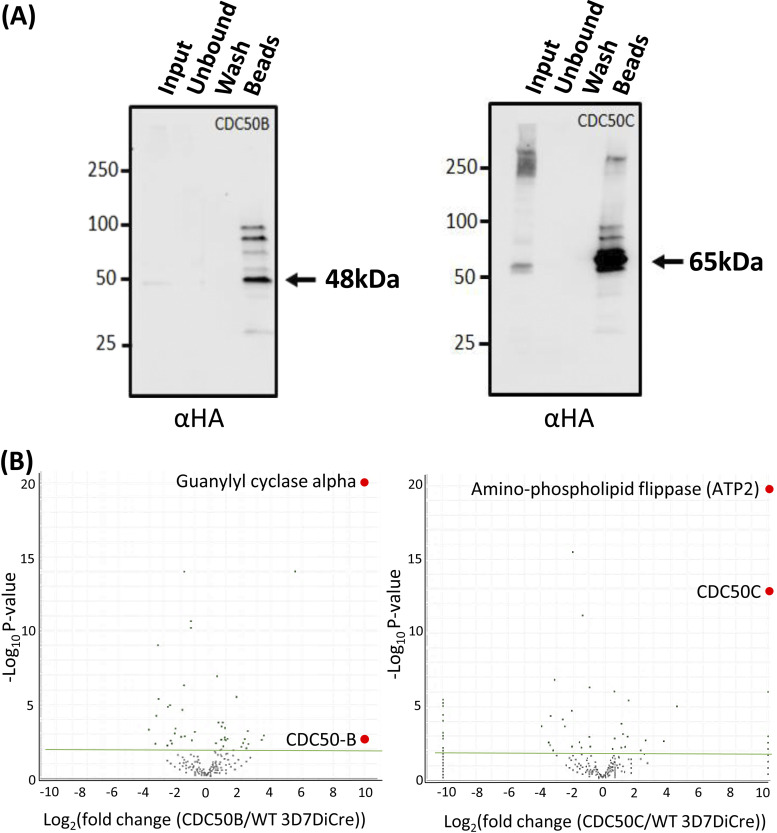
FIG 3.
(A) Western blotting demonstrates efficient immunoprecipitation (IP) of CDC50B-HA and CDC50C-HA from schizont extracts. Arrows indicate the predicted mass of each protein. Images are representative of two independent experiments. (B) Mass spectrometric identification of interacting partners of CDC50B and CDC50C by analysis of proteins enriched through IP (panel A). Volcano plot of P values versus the corresponding log2 fold change in abundance compared to 3D7DiCre control samples (Fisher’s exact test). A green line indicates a P of −2log10, and green dots represent peptides where the P is less than −2log10. Peptides for GCα and ATP2 were enriched to a P of less than −19log10. A list of enriched proteins is found in Table S1 in the supplemental material.

